


Abstract
This study investigates early COVID-19 communication strategies and content of four public health and four news media organizations across Australia, China, the UK, and the US on X (formerly Twitter) and their public engagement. 15,711 COVID-19-related tweets from the selected accounts posted from January 1 to May 19, 2020, were collected using a web crawler. Public engagement was measured through replies, retweets, and likes. The tweets were grouped into 37 clusters using unsupervised learning and analyzed thematically based on the top 30 tweets per cluster. Descriptive statistics quantified the tweets and their engagement, and a chi-square test compared differences between the two organization types across topics. Six topics were identified: “policies, methods, and action”, “case updates”, “opinions and responses”, “medical research and treatment information”, “impacts and consequences”, and “health instructions and suggestions”, with five communication phases: inception, awareness, panic, spreading, and cohabitation. Analysis revealed that more hashtags and longer texts were associated with lower engagement, except for tweets on “medical research and treatment information” and “health instructions and suggestions”. Our study indicated that fewer hashtags and concise language might improve public engagement, while detailed content with more hashtags was effective for specific health instructions. Overall, tweets about treatment progress and health guidance received the most engagement.
Introduction
The COVID-19 pandemic has dramatically affected global health, the economy, and social life1,2,3. Effective communication of accurate, timely information is critical to guiding public behavior, controlling virus transmission, and alleviating panic4. The success of crisis response strategies and public security depends on the ability of governing bodies and communities to communicate information5,6.
Public health and news media organizations play key roles in crisis communication. Public health organizations serve as professional opinion leaders, providing accurate information to the public, developing response strategies, and countering misinformation through fact-checking7. Meanwhile, news media organizations relay this to the broader public, updating them on developments and promoting safety measures8,9. This collaboration, underpinned by the “two-step flow of communication” theory10, keeps the public informed on virus transmission, prevention, and vaccines, supporting informed decisions and public safety11.
Social media platforms, such as X (formerly Twitter), TikTok, and Instagram have become key sources of information during crises12, enabling health professionals and other enterprises to serve as influential “health pedagogues” to guide the public in navigating content amidst “digital misinformation”13. These platforms accelerate communication, provide immediate public feedback, and reveal societal sentiments and informational needs14, informing communication strategies to address public concerns, adapt to cultural and linguistic contexts, and communicate complex information effectively15,16,17. However, they also pose challenges due to the rapid spread of misinformation, making monitoring essential18.
Existing research on COVID-19 communication has mainly focused on public perceptions of social media19,20,21,22,23 and the spread of fake news24,25. Among studies in the complementary fields of communication, journalism, and news media, researchers have conceptualized the circulation of disinformation by investigating how, when, and why active social media users engage with fake news24, as well as how they observe, experience, and conduct “social corrections” in the face of dysfunctional sharing25. Meanwhile, experts’ use of platforms such as X, demonstrates how peer-to-peer communication bridges extended content and social networking functions inclusive of general society26. Despite various strategies by public health and news media organizations, gaps remain in comprehending their impact on public response, the roles these organizations play and how these roles change over time.
Moreover, most empirical studies on pandemic-related social media posts are either cross-sectional27,28,29,30 or region-specific27,30,31,32,33. Although research has explored the effects of strategies such as hashtag use and text length (i.e., the word count of a tweet) on public engagement34,35, little is known about how these strategies perform across varied content. This study addresses these gaps by analyzing how public health and news media organizations communicated COVID-19 information on X during the early pandemic (January 1 to May 19, 2020) and the public engagement with these tweets, focusing on the following research questions:
RQ1. What topics did public health and news media organizations tweet about during the early COVID-19 pandemic and how did the public engage?
RQ2. How did these topics and public engagement change over time?
RQ3. Did the number of tweets and public engagement vary across topics based on communication strategies (such as tweet length and hashtag use)?
Theoretical framework
Agenda-setting theory
Agenda-setting theory critically explains social media’s role in shaping public attention and perception36,37. It suggests that media coverage, by emphasizing certain themes, directs public focus toward specific issues38. Social media portrayals of the outbreak, including recovery narratives, varied regionally, significantly impacting public trust and decision-making through their portrayal of facts and guidance39. This highlights their crucial role in framing public understanding of health risks and preventive measures. During this period, public health and news media organizations played a key role in conveying policy messages, not only by alerting the public and constructing the epidemic agenda but also by guiding public opinion and spreading knowledge40,41. However, the scientific accuracy and potential exaggeration in reporting affected public trust42. Therefore, analyzing social media topics is critical to understanding crisis communication content and identifying public concerns and misinformation, enabling real-time adjustments in communication strategies.
Situational crisis communication theory
Situational crisis communication theory offers guidance on effective crisis communication, emphasizing the need to prioritize public safety through two main approaches: providing clear instructions on how to protect against physical harm, and addressing psychological well-being43,44. This includes disseminating safety measures and offering mental health support to help individuals cope with the crisis45. Accurate, timely information is also crucial to prevent misinformation and panic. This theory is essential for evaluating the effectiveness of early COVID-19 communications, as it helps identify the crisis type, assess threat levels, and recommend strategies to manage public perceptions and rebuild trust. By applying this framework, researchers can determine whether initial messaging addressed public concerns, matched the crisis severity, and guided behavior effectively, providing insights to refine communication strategies for future health crises.
Use and gratification theory
Use and gratification theory suggests that people consume media to fulfill needs such as information gathering, social interaction, and self-expression. Social media offers an advantage over traditional media by enabling community-building and active user engagement46. Shao identifies three ways people use media to meet diverse needs47. First, they passively consume content for information or mood management (e.g., reading news or watching movies to relax). Second, they interact with content and users to enhance social connections, such as replying, retweeting, and liking on X to engage with virtual communities. Third, they create content for self-expression, sharing posts or comments to convey their opinions.
Social media’s interactive features—replies, reposts, and likes—shape how the public engages with health and news content19,21,48. Replies allow users to respond and start conversations49. Reposts (retweets) extend the original post’s reach, fostering long-term advocacy49,50. Likes serve as quick endorsements, showing appreciation for content51. Although these engagement types often overlap, each form can exhibit unique patterns based on differing levels of information use and satisfaction48,52.
Crisis life cycle theory
Crisis life cycle theory outlines communication and response patterns across different crisis stages53,54. Coombs identifies three phases: pre-crisis (prevention and preparation), crisis (response), and post-crisis (learning and revision)53. Each phase requires tailored communication strategies to minimize impact on the organization and its stakeholders. Understanding these shifts is crucial for analyzing how information and public engagement evolve, particularly during a pandemic.
This study integrates four theoretical frameworks to analyze COVID-19 communications by public health and news media organizations on X. Agenda-setting theory explains how these organizations highlight certain issues to shape public opinion. Situational crisis communication theory explores how they manage messaging to maintain credibility. Uses and gratifications theory sheds light on why the public engages with these communications, suggesting people seek information that meets their informational and social needs. Finally, crisis life cycle theory contextualizes these interactions, showing how communication strategies adapt throughout different crisis stages.
Materials and methods
Ethics consideration
This study did not involve human participants or the use of personal user data. All data were sourced from publicly available tweets on official X accounts. As a result, ethical approval from an Institutional Ethics Committee was not required.
Data sources
Four countries were included in this study: Australia, China, the UK, and the US. This selection was based on their distinct roles in the COVID-19 pandemic and their distinct public health system, diverse sociopolitical contexts, and varied roles during the early stages of the COVID-19 pandemic. Our primary objective was to provide a representative range of crisis communication approaches, which builds on the diverse geopolitical insights from previous studies21,55,56,57,58. Australia was selected because of its strong public health system and its commendable COVID-19 response. Moreover, a significant portion of our research team is based in Australia, allowing direct insight into its public health strategies and communication practices. China was included due to its unique position as the first country to report COVID-19, shedding light on initial outbreak communication. Although X has only limited presence in China, we sought to explore how crisis messaging emerged at the pandemic’s point of origin. The UK and the US were also selected because these public health agencies were known to have reach and influence beyond their respective countries. Specifically, the UK’s public health system closely mirrors that of Australia. This similarity facilitates a comparative analysis of public health communication strategies between these countries. One member of our research team (H.Y.) was based in the US at the onset of the pandemic, enabling timely data collection and first observations of American responses to public health directives. While X use may not be archetypal to the general population59, these four countries represent key markets for the exchange of medical and health-related communication via major social media platforms60.
After identifying the countries, we initially searched for the public health organizations in each. Both China and the US have dedicated Centers for Disease Control (CDC), whereas the UK and Australia do not have specific CDCs; instead, their roles are filled by the UK National Health Service (NHS) and the Australian Government Department of Health and Aged Care (DHAC), respectively. The X accounts were found on their official websites. The news media in each country were specifically selected for their substantial influence and popularity, given their established reputation offline and significant followings outside the world of social media. Their selection was based on the size of the country and the relatively large population of active users on X, ensuring that they truly represent the national discourse. Finally, four accounts comprised highly active public health organizations in each of these four countries—the Australian DHAC; the Chinese CDC; the UK NHS; and the US CDC, which are among the leading science-based, policy-driven institutions in large countries seeking to safeguard public health. The other four accounts encompassed preeminent news media organizations in each of these four countries: The Australian; China Daily; British Broadcasting Corporation; and Cable News Network (Table 1).
Web crawler technology and X API were used to collect data from the eight identified X accounts. The API allowed us to retrieve the following types of data for each tweet: (1) original tweet text, (2) post date, (3) public engagement metrics (i.e., replies, retweets, and likes), and (4) the hashtags used61. API queries were authenticated and parameterized to ensure precise retrieval of data over 21 weeks, from January 1 to May 19, 2020, based on account-specific identifiers.
To ensure statistical reliability in detecting significant differences across two groups (public health organizations vs. news media organizations), we calculated the required sample size based on a large effect size (Cohen’s d = 0.5), achieving 95% power at a 0.05 significance level63. This analysis indicated a need for a minimum of 105 tweets per group, totaling 210 tweets for the study.
Finally, to explicitly address the potential confounding impact, our data collection was concluded before the resurgence of the Black Lives Matter movement, significantly propelled by the killing of George Floyd64. This decision was made to clearly define the study period and avoid the substantial shifts in public opinion and behavior that such an event could cause. The study period of 21 weeks provided an adequate dataset while ensuring manageability in data processing and analysis.
Using unsupervised machine learning to cluster the “topics” of tweets
This study utilized multiple software tools and libraries throughout the analysis:
-
R (RStudio Team, 2016): Libraries tm, NLP, and plyr were used for text mining and preprocessing tasks62.
-
Python: Employed for advanced analytics, including word embedding (using GloVe), binary code conversion, convolutional neural network modeling, and clustering with K-means.
-
Excel: Used for qualitative content analysis and categorization of machine-identified clusters.
-
IBM SPSS (version 26): Used for statistical analysis, including chi-square tests and Spearman correlation analysis.
Data pre-processing
Using the R programming language, the data was filtered by the keywords “coronavirus disease 2019”, “COVID-19”, “coronavirus”, “Corona”, “COVID”, “2019-nCoV acute respiratory disease”, “novel coronavirus pneumonia”, “novel pathogenic severe pneumonia”, “Wuhan acute respiratory syndrome (WARS)” and “SARS-CoV-2”, then punctuation, numeric digits, split words (‘s, ‘t, ‘ve), whitespace, stop words and duplications were removed65.
Hashtags were not pre-selected but were directly extracted from the original tweet text during the text preprocessing stage. This ensured that all hashtags naturally included by the organizations were analyzed without additional filtering or selection criteria, maintaining the authenticity and representativeness of the dataset.
Unsupervised machine learning to cluster the tweets
After data preprocessing, tweets were embedded into 200-dimensional numerical vectors, representing semantic features of words in a multi-dimensional space, using a pre-trained GloVe model66. The average word embedding was applied to reduce the dimensionality of the data to compact binary codes67,68. These vectors were converted to binary codes in the Python program, which were then processed by a convolutional neural network (CNN) to extract deep feature representations69. The CNN used layers of convolutional filters to detect patterns or local features in the text data70. In the context of tweets, which were limited in length, CNN focused on extracting significant features from these short texts, such as key phrases, hashtags, and other linguistic patterns71. These features provided a deep understanding of the text’s content, sentiment, or thematic elements, despite the brevity of the text.
Afterward, an unsupervised K-means clustering was applied to group tweets into clusters based on their semantic features72,73. This initial selection of K = 6 was based on an exploratory approach, starting with a manageable number of clusters and then incrementally increasing it to find the optimal number72. The K-means algorithm minimizes the squared error between samples and centroids. It defines the sum of squared distances between each sample and its cluster centroids as the ‘distortion’ value73. This distortion tends to decrease as the number of clusters increases. However, for data that exhibits a certain level of distinctness, there is a significant improvement in the degree of distortion when it reaches a specific threshold. This threshold can be likened to an ‘elbow’ inflection point, signifying a point of optimal clustering performance. This led to the identification of 37 clusters, informed by the finding that optimal clustering occurred at K = 37.
To measure the performance of the clustering method, 300 tweets were randomly selected for manual annotation and classification to produce the golden standard as the reference74. This manual clustering was then compared to the machine-identified clusters. Key metrics calculated included accuracy and F-score. The evaluation used true positives (TP, tweets correctly identified by both the algorithm and manual classification), false positives (FP, tweets identified by the algorithm but not by manual classification), and true negatives (TN, tweets neither identified by the algorithm nor manual classification) and false negatives (FN, tweets missed by the algorithm but identified manually).
Inductive qualitative content analysis to further refine and condense the clusters
As the number of clusters derived from unsupervised machine learning was too large to allow a clear human perception of the key topics presented, we applied an inductive, qualitative content analysis method to further group the content into topics. We used a Microsoft Excel spreadsheet for data organization, cluster aggregation, and qualitative coding support75. The top 30 tweets were selected in each cluster, totaling 1100 tweets across 37 clusters, were identified based on their cosine similarity scores to the respective cluster centroid76. The cosine similarity score was used to determine the semantic alignment of tweets with their respective cluster centroids. Higher scores indicate stronger semantic alignment.
Three researchers independently coded all 1100 selected tweets by examining each tweet verbatim to determine its core meaning and latent themes77,78. Clusters with similar meanings were compared, aggregated, and grouped into an overarching category. Any discrepancies were resolved through consensus-building discussions, arbitrated by the fourth researcher. After establishing representative categories, all tweets in each cluster were reassigned to these categories to ensure consistent classification.
Statistical analyses
The unit of analysis was a tweet. First, we counted the number of tweets posted by public health and news media organizations on each topic and the number of replies, retweets, and likes attracted per tweet, then converted all these to a proportion of the total of the six topics. The comparison between the two types of organizations was facilitated by categorizing the pandemic into distinct communication phases, informed by analyzing trends, amplitudes, and inflection points of the four key indicators. Each phase was named based on combining the trend in the number of tweets and public engagement, with relevant events identified from the tweet content.
Second, a chi-square test was conducted to examine whether there were differences between the two types of organizations in the number of tweets and the number of replies, retweets, and likes per tweet. Third, a nonparametric Spearman correlation analysis was conducted to determine the correlation between the three variables of public engagement, “reply”, “retweet”, and “like”, and the two variables of communication strategy: the number of hashtags and length of a tweet. All statistical analyses were conducted using IBM SPSS (version 26)79,80,81. Statistical significance was determined by P < .0.05.
Results
Public health organizations posted fewer tweets (1149) than news media organizations (14,562). On average, public health organizations received fewer replies but more retweets and likes per tweet (51 replies, 337 retweets, and 615 likes/tweet) compared with news media organizations (65 replies, 146 retweets, and 420 likes/tweet).
The machine-learning algorithm categorized 15,711 tweets into 37 clusters, achieving 75% accuracy and a 0.76 F1 score, indicating good and acceptable performance based on the previous research standards82.
Tweet topics
The 37 clusters were manually grouped into six topics: (A) policies, methods, and action, (B) case updates, (C) opinions and responses, (D) medical research and treatment information, (E) impacts and consequences, and (F) health instructions and suggestions. Table 2 provides descriptions and examples. Table 3 shows tweet counts and the number of replies, retweets, and likes per tweet.
-
a.
(A) Policies, methods and action. This topic included organizational measures to curb virus spread, such as density restrictions, altered supermarket hours, service guarantees, travel bans, and hospital procedure changes. It also covered economic support policies like a $1 billion boost for the US Department of Veterans Affairs, payroll tax relief in Victoria, and initiatives to boost car sales in China. Actions by individuals or organizations to combat COVID-19, such as Ruth May’s call for retired nurses to return, Justin Bieber’s support video for Wuhan, and safety measures by retailers like Walmart, were also included. This was the most-tweeted topic, with 4231 tweets (26.9%).
-
b.
(B) Case updates. This topic focused on real-time reports and statistics on COVID-19 outbreaks, transmissions, case numbers, and death tolls by region. It included notable events such as the Ruby Princess cruise ship outbreak in Australia and Prince Charles testing positive in the UK. This topic was covered by 3,647 tweets (23.2%).
-
c.
(C) Opinions and responses. This topic captured reactions and viewpoints from politicians, health experts, influencers, and the public on COVID-19 and related events. Examples include debates on reducing social distancing in the US, criticism of President Trump’s suggested treatments, and New Jersey’s social distancing measures. This topic was covered by 3242 tweets (20.6%) and received the highest average engagement with 121 replies and 551 likes per tweet.
-
d.
(D) Medical research and treatment information. This topic mainly included news and research on virology, pathology, transmission methods, medications, vaccines, and treatment standards. Examples include challenges in preventing COVID-19 compared to SARS, studies on transmission through prolonged contact, and claims about chloroquine and hydroxychloroquine as treatments. This topic was covered by 1819 tweets (11.6%).
-
e.
(E) Impacts and consequences. This topic reported the health, economic, and social impact of COVID-19. It included COVID-19 casualties, economic downturns, business bankruptcies, school and workplace closures, and shifts to online education and work. It also covered major event disruptions like the postponement of the Tokyo Olympics, closures of California’s Universal Studios and LA Zoo, and the cancellation of BTS’s Seoul tour. This topic was covered by 1638 tweets (10.4%) and received the lowest engagement (24 replies, 74 retweets, and 213 likes/tweet).
-
f.
(F) Health instructions and suggestions. This topic provided guidance on preventing virus spread, including mask-wearing, social distancing, staying home, and hand hygiene. It also addressed frequently asked questions, shared expert advice, and provided links to relevant resources. An example tweet: “Are facemasks useful? Where can I get the latest travel advice? Can I get coronavirus from food? Watch this video for answers.” Despite being the least-tweeted topic (n = 1,34, 7.2%), it received the highest average retweets (221 retweets/tweet).
A comparison of number of tweets and public engagement between public health and news media organizations on various topics
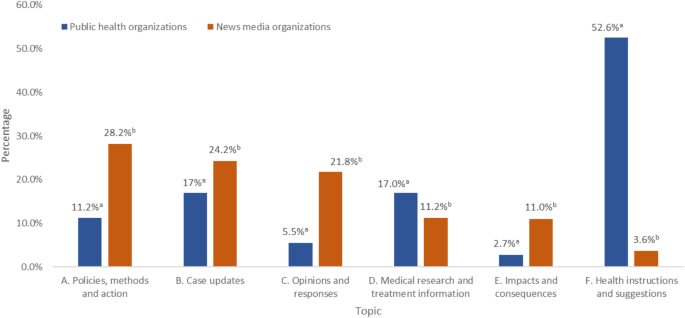
A significant difference was found in the number of tweets the two types of organizations posted on each of the six topics (Fig. 1). Public health organizations tweeted the most about “health instructions and suggestions” (n = 604, 52.6% of their total), while news media tweeted the fewest on this topic (n = 530, 3.6% of their total). Public health organizations tweeted least on “impacts and consequences” (n = 31, 2.7% of their total), while news media tweeted most about “policies, methods, and action” (n = 4102, 28.2% of their total).

Comparison of the percentage of tweets on each topic by organization type. Superscripts ‘a’ and ‘b’ indicate statistically significant differences between the two organization types in the percentage of tweets within each content category, based on a chi-square test (p < .005)..
Public engagement varied significantly between the two organization types across all six topics. Overall, “likes” were the most common response, followed by “retweets” and then “replies” (Fig. 2). Tweets on “medical research and treatment information” attracted the most retweets (public health: 533 retweets/tweet vs. news media: 179 retweets/tweet) and received the most replies and likes from public health organizations’ tweets (72 replies/tweet, 980 likes/tweet). For news media organizations, “opinions and responses” had the highest replies and likes (123 replies/tweet, 553 likes/tweet). “Impacts and consequences” received the lowest engagement for both types of organizations (public health: 31 replies/tweet, 182 retweets/tweet, 317 likes/tweet; news media: 24 replies/tweet, 72 retweets/tweet, 211 likes/tweet).

Comparison of replies, retweets and likes per tweet on each topic by organization type.
Communication phases
Five communication phases were identified by the trend, amplitude, and inflection point of the number of tweets, replies, retweets, and likes (I) inception phase, (II) awareness phase, (III) panic phase, (IV) spreading phase, and (V) cohabitation phase (Fig. 3).

Changes in the number of tweets and the public engagement they attracted over time.
Phase I: inception phase (Jan 1–21, 2020)
Started with the WHO’s first COVID-19 announcement (Jan 5) and ended after China confirmed human-to-human transmission (Jan 21). Tweets focused on identifying the virus and its potential threat. For example, a tweet posted by China Daily claimed, “An expert team found a new coronavirus on Tuesday at a lab after analyzing samples collected from the cases”, illustrating the early efforts to comprehend the emerging health crisis, marking this period the “inception phase”. Despite the fewest tweets posted per week (24 tweets/week) during this period, these tweets sparked an intense response from the public, attracting the highest average weekly replies and retweets (16 replies/tweet/week, 62 retweets/tweet/week). The public’s strong interest reflected the urgency to share early information.
Phase II: awareness phase (Jan 22–Feb 4, 2020)
The pandemic spread globally, with initial cases in Singapore (January 23), France (January 24), and Australia (January 25). Quarantine in Wuhan and US flight suspensions drove a surge in tweets (789/week), receiving the highest average likes (106 likes/tweet). This phase reflected a high level of public engagement of the virus crossing borders signifying the onset of the so-called “awareness phase”.
Phase III: panic phase (Feb 5–18, 2020)
Global deaths reached 1,000, and WHO named the virus COVID-19. Despite rising cases, tweets dropped to 280/week, and public engagement was low (7 replies/tweet/week). Such a brief period of stagnation was termed the “panic phase”, characterized by global panic and the severe disruption to everyday life caused by the pandemic. For example, the Australian tweeted “Rumours of toilet paper food shortages send Hong Kong residents into coronavirus panic buying frenzy”.
Phase IV: spreading phase (Feb 19–Mar 31, 2020)
After confirming more than 118,000 cases and 4,291 deaths in 114 countries, WHO declared COVID-19 a pandemic, pushing tweet activity to its peak (1,086/week), known as the “spreading phase”. Discussions covered virus mutations, vaccine research, and health recommendations, but engagement was lower (71 likes/tweet/week), indicating information overload amidst the crisis.
Phase V: cohabitation phase (Apr 1–May 21, 2020)
The number of tweets declined (998/week), and retweets hit their lowest (24/tweet/week). With fewer “hot topics,” public engagement waned as people adjusted to living with the virus, marking the normalization of the pandemic. Consequently, this period has been called the “cohabitation phase”.
A comparison of number of tweets and public engagement between the two types of organizations in different phases
News media organizations consistently posted more tweets than public health organizations across all five phases. In the inception phase, news media organizations posted 5.5 times more tweets, peaking at 24 times in the awareness phase, and then gradually declining to 19.7, 14.4, and 10.2 times in the panic, spreading, and co-habitant phases, respectively.
In terms of public engagement, news media organizations attracted 2.1, 1.1, and 2 times more replies per tweet than public health organizations in the inception, awareness, and cohabitation phases, respectively. However, during the panic and spreading phases, news media organizations received only 23.3% and 84.5% of the replies per tweet compared to public health organizations. News media organizations consistently attracted fewer retweets per tweet than public health organizations across all phases, ranging from 65.4 to 57.2% of the retweets per tweet that public health organizations received. Similarly, news media organizations attracted more likes per tweet in the inception (1.04 times) and awareness (1.4 times) phases, but fewer likes in the panic (47.3%), spreading (55.9%), and cohabitation (83.6%) phases.
Significant differences were found between the two organization types in the number of tweets, retweets, and likes per tweet across all five phases, and the number of replies per tweet in the inception, panic, and spreading phases (Table 4). The chi-square tests confirmed these differences with p-values < 0.05 for all highlighted metrics.
A comparison of number of tweets and public engagement between two organization types on various topics across five pandemic phases
During the inception phase, public health organizations posted 11 tweets over three weeks (Table 5). Three tweets on “case updates” were from the Chinese CDC (n = 2) and the Australian DHAC (n = 1), attracting minimal engagement (1 reply, 2 retweets, and 4 likes per tweet). The remaining eight tweets were from the US CDC, covering “health instructions and suggestions” (n = 3), “policies, methods and action” (n = 3), “impacts and consequences” (n = 1) and “medical research and treatment information” (n = 1). The tweets on “policies, methods and action” attracted the most retweets and likes (575 retweets and 516 likes/tweet), and the tweets on “impacts and consequences” attracted the most replies (54 replies/tweet). In contrast, news media organizations posted 60 tweets in this period, dominated by “case updates” (n = 30). Only two tweets each were on “health instructions and suggestions” (The Australian: n = 1; China Daily: n = 1) and “policies, methods and action” (China Daily: n = 1; CNN: n = 1). The 14 tweets on “medical research and treatment information” attracted the highest engagement (109 replies, 342 retweets, and 419 likes/tweet), whereas the seven tweets on “opinions and responses” saw the lowest (3 replies, 10 retweets, and 35 likes/tweet).
In the awareness phase, public health organizations increased the number of tweets, posting 63 tweets in 2 weeks. The most frequent topic was “health instructions and suggestions” (n = 22), with 17 from the Australian DHAC, four from the UK NHS and one from the Chinese CDC. The fewest tweets were on “opinions and responses” (n = 3), all from the US CDC, which attracted the highest engagement (68 replies, 477 retweets, and 563 likes/tweet). The 153 tweets on “impacts and consequences” attracted the lowest engagement (11 replies, 443 retweets, and 102 likes/tweet). In contrast, the four tweets on “impacts and consequences” (Chinese CDC: n = 2, Australian DHAC: n = 2) attracted the lowest engagement (5 replies, 16 retweets, and 13 likes/tweet). News media organizations also increased their activity, posting 1,515 tweets. Their most common topic was “policies, methods, and action” (n = 483), while “health instructions and suggestions” (n = 32) were the least posted. Tweets on “case updates” (n = 419) attracted the most engagement (35 replies, 145 retweets, and 270 likes/tweet).
In the panic phase, public health organizations posted 27 tweets over 2 weeks, a decrease from the previous phase. “Health instructions and suggestions” remained the most frequent topic (n = 10), with contributions from the Australian DHAC (n = 5), UK NHS (n = 3), and Chinese CDC (n = 2). These tweets attracted the highest average replies (103 replies/tweet). The single tweet on “impacts and consequences” from the Australian DHAC attracted the fewest average replies (2 replies/tweet). The three tweets on “medical research and treatment information” from the US CDC (n = 2) and the Chinese CDC (n = 1) attracted the highest average retweets (425 retweets/tweet). The three tweets on “policies, methods and action” from the US CDC (n = 2) and the UK NHS (n = 1) attracted the highest average likes (634 likes/tweet). Conversely, the three on “opinions and responses” from the Australian DHAC (n = 2) and the Chinese CDC (n = 1) saw the lowest average retweets and likes (7 retweets and 4 likes/tweet). Similarly, news media organizations reduced their posts to 532 tweets during this period. The most common topic was “policies, methods, and action” (155 tweets), which also received the highest average retweets (81 retweets/tweet) and likes (219 likes/tweet). Tweets on “case updates” (n = 131) had the highest average replies (19 replies/tweet). In contrast, “impacts and consequences” (78 tweets) saw the lowest engagement (5 replies, 15 retweets, and 48 likes/tweet).
In the spreading phase, public health organizations increased their posts with 423 tweets over seven weeks. “Health instructions and suggestions” dominated with 220 tweets, while “impacts and consequences” had the fewest (n = 13). The 83 tweets on “medical research and treatment information” received the highest engagement (120 replies, 860 retweets, 1,525 likes/tweet), whereas the 30 tweets on “case updates” saw the lowest (47 replies, 199 retweets, and 326 likes/tweet). News media organizations also saw a sharp rise, posting 6093 tweets. The most common topic was “policies, methods, and action” (n = 1807), while “health instructions and suggestions” remained the least covered (n = 244). “Case updates” attracted the most average retweets (189 retweets/tweet), while “opinions and responses” attracted the most average replies and likes (112 replies and 536 likes/tweet). In contrast, “impacts and consequences” (n = 746) saw the lowest engagement (23 replies, 91 retweets, and 240 likes/tweet).
In the cohabitation phase, public health organizations posted 631 tweets over seven weeks, with 349 on “health instructions and suggestions”. However, the 74 tweets on “case updates” attracted the highest engagement (64 replies, 385 retweets, and 1244 likes/tweet). In contrast, the 12 tweets on “impacts and consequences” (Australian DHAC: n = 8, UK NHS: n = 3, US CDC: n = 1) had the lowest engagement (22 replies, 81 retweets, and 160 likes/tweet). News media organizations posted 6435 tweets, still dominated by “policies, methods and action” (n = 1655), while “health instructions and suggestions” remained the least covered (n = 237). The 687 tweets on “medical research and treatment information” attracted the most average retweets (207 retweets/tweet), while the 1604 tweets on “opinions and responses” attracted the most average replies and likes (150 replies and 640 likes/tweet). “Impacts and consequences” (n = 626) continued to receive the lowest engagement (31 replies, 65 retweets, and 224 likes/tweet).
Differences in public engagement by topic uzing different communication strategies
Use of hashtags.
The correlation between the number of hashtags and public engagement varied for public health and news media organizations (Table 6). For news media organizations, a significant negative correlation was observed between hashtag usage and replies, retweets, and likes across all topics (all P < .0.01). In contrast, for public health organizations, the same negative correlation appeared only in the “case updates” topic (P < 0.01 for replies, retweets, and likes). Significant positive correlations were found for public health organizations between hashtag use and engagement in “health instructions and suggestions” and “policies, methods, and action” (P < .01 for replies, retweets, and likes), as well as for retweets and likes in “medical research and treatment information” (P < 0.01).
Length of the tweet
The correlation between tweet length and public engagement varied between public health and news media organizations (Table 7). For public health organizations, tweet length showed significant positive correlations with replies, retweets, and likes in “medical research and treatment information,” “health instructions and suggestions” (all P < 0.01), and “opinions and responses” (P < 0.05 for replies and likes; P < 0.01 for retweets). In contrast, for news media organizations, positive correlations were found only for “health instructions and suggestions” (P < 0.01 for replies) and “opinions and responses” (P < 0.01 for replies, retweets, and likes).
No significant correlation was observed for public health tweets in “case updates,” “impacts and consequences,” or “policies, methods, and action”. However, tweets from news media organizations showed significant negative correlations between tweet length and replies, retweets, and likes in “impacts and consequences” and “policies, methods, and action” (all P < 0.01), as well as for retweets and likes in “case updates” (P < 0.01).
Discussion
Principal results
This study analyzed 15,711 tweets from four public health organizations and four news media organizations across four countries and the public engagement during the early COVID-19 pandemic (January 1–May 19, 2020). These tweets were first divided into 37 clusters using unsupervised machine learning and then grouped into six main categories using qualitative content analysis: (A) policies, methods, and action, (B) case updates, (C) opinions and responses, (D) medical research and treatment information, (E) impacts and consequences, and (F) health instructions and suggestions. Analysis of trends, amplitudes, and inflection points in the number of tweets, replies, retweets, and likes identified five communication phases: inception, awareness, panic, spreading, and co-habitation.
The results showed public health organizations tweeted most about “health instructions and suggestions” and least about “impacts and consequences”, while news media tweeted most on “policies, methods, and action” and least on “health instructions and suggestions”. In terms of public engagement, “likes” were the highest, followed by “retweets” and then “replies”. The least engaging topic for both types of organizations was “impacts and consequences”, while “medical research and treatment information” attracted the most retweets. For replies and likes, public health organizations saw the most engagement with “medical research and treatment information”, while news media saw the highest engagement with “opinions and responses”.
For different communication strategies, the more hashtags used, the less the public engaged in replies, retweets, and likes. Longer tweets received fewer retweets overall but did not affect replies or likes. Post hoc analysis on each topic found the longer the tweet length, the more retweets and likes attracted on “medical research and treatment information” and more replies, retweets, and likes on “health instructions and suggestions”.
Comparison with prior work
Although existing literature examined information communication on social media during public health crises, most of these studies focused on public sentiment toward a single type of information13,23,27,29,35,83,84,85. This study used computational-aided qualitative content analysis to cluster tweet content more comprehensively and fine-grained into six topics. This approach improved data processing efficiency and accuracy, reducing manual error and enhancing result interpretation86. The findings provide valuable insights for enhancing communication, public relations, and community engagement strategies in public health and news media organizations.
Whether the different organizations perform their traditional roles in the COVID-19 context and over time?
Our findings align with previous studies20,23,85, showing that social media serves as a valuable tool for monitoring public health and news media activities and public engagement during health crises. Consistent with agenda-setting theory, the distinct thematic focuses suggest each organization set a unique public agenda36,39. Specifically, public health organizations posted fewer tweets, mainly on “health instructions and suggestions”, while news media organizations shared more tweets focused on “policies, methods, and action”.
Although news media organizations focused heavily on “policies, methods, and action,” public engagement with these posts was relatively low. This may be because, during a health crisis, news media use social media to relay policy updates specific to local situations, targeting organizations rather than engaging individuals6,87. Conversely, “opinions and reactions” received higher engagement, likely because they invite personal relevance and interaction, resonating emotionally with the audience88,89. The highest engagement was seen in “medical research and treatment information,” aligning with the uses and gratifications theory52. It suggested that during crises, people seek content that addresses their immediate needs and concerns.
Notably, the tweets from public health organizations gained significantly more engagement (replies, retweets, and likes) compared to those from news media organizations. This trend can likely be attributed to the nature of the content. According to situational crisis communication theory, this reflects varying public perceptions and trust levels, highlighting the need for tailored communication strategies22,44,90. Public health tweets are often based on expert assessments, adding credibility and reliability, which may explain fewer tweets but higher engagement. The public’s active responses suggest they view this information as critical, indicating greater trust in these organizations during the pandemic91. These present an opportunity for more in-depth exploration in future research.
From a dynamic perspective, public health organizations initially concentrated on communicating information related to “policies, methods and action”, “medical research and treatment information” and “health instructions and suggestions”, reinforcing their role as authoritative sources of guidance. In contrast, news media prioritized “case updates”, reflecting their critical role in rapidly communicating the evolving situation of the pandemic.
As the pandemic progressed through the awareness and panic phases, both public health and news media organizations significantly increased their tweets across all themes, reflecting efforts to meet the growing public demand for timely, comprehensive information. Notably, news media organizations expanded beyond “case updates” to include more “medical research and treatment information” and “policies, methods, and action”, showcasing a shift towards providing in-depth analysis and critical perspectives on the pandemic’s unfolding events. During the spreading and cohabitation phases, the continued focus on these themes underscored both organizations’ dedication to public education and scientific guidance. This pattern suggests that news media may have broadened the information landscape through diverse topic coverage, potentially enabling opinion leaders to shape discourse, as described by the two-step flow of communication theory10. However, further research is needed to examine how these dynamics unfold on social media during public health crises.
How could public health and news media organizations more effectively communicate with the public during crises?
Our findings suggest tailored strategies for both organization types. Public health organizations should increase hashtag use for content related to “policies, methods, and action”, “medical research and treatment information”, and “health instructions and suggestions” while reducing hashtags for “case updates” to increase engagement. For news media, minimizing hashtags across all categories is recommended. Engagement patterns indicate that concise tweets work best for factual information, while longer, detailed tweets are more effective for advisory content. This approach can enhance public relations and community building during future crises. Interestingly, these results differ from Weibo studies, where longer posts attracted more engagement22,92, possibly due to cultural differences. Weibo’s user base is predominantly Chinese, while X is popular in Western contexts93. Future research could explore cultural variations in responses to social media strategies, such as hashtag use.
The evolving social media landscape has critical implications for public health crisis communication. Our findings, aligned with crisis life cycle theory, highlight how communication needs and strategies shift at different crisis stages, underscoring the need for adaptable approaches54. In today’s rapidly changing social media environment, public health and news media organizations must refine their strategies—using more targeted, concise language and strategic hashtag use to boost engagement and clarity. As platforms like X continue to evolve, especially post-COVID-19, their role in crisis communication grows more complex94,95. Organizations must remain agile, continuously analyzing and adjusting to how audiences consume and react to information.
Limitations
This study has several limitations. First, we did not formally calculate inter-observer reliability for the qualitative content analysis. Instead, we adhered to a collaborative, consensus-driven approach in which multiple researchers jointly developed and iteratively refined the coding framework. Although this methodology, combined with advanced clustering techniques, helped to mitigate observer bias and expedite theme detection, the absence of a reliability statistic may limit replicability. Second, our focus on the early stages of the COVID-19 outbreak limited insights into the entire pandemic. While this choice provided a manageable dataset and captured initial shifts in public engagement, it may not reflect later shifts in public attitudes. Third, the limited presence of X in China may result in an underrepresentation of tweets from that country. However, because this platform constraint presumably impacts both public health and news media accounts equally, the influence on comparative findings is likely minimal. Fourth, this study focuses on four countries with distinct public health systems and global influence during the COVID-19 pandemic. While this selection allows for meaningful comparative analysis, we acknowledge its limitations in generalizability. Similarly, the limited number of accounts included was chosen to facilitate depth of analysis but may not encapsulate the full range of communication strategies used across diverse context. Future research should consider a broader set of countries to capture varied cultural and regulatory environments and to enhance the external validity of the findings. Fifth, reliance on hashtags and tweet length alone may not fully explain communication effects; therefore, future studies might incorporate additional message features (e.g., visuals, external links) or more nuanced analyses (e.g. sentiment). Six, due to the brief nature of tweets, machine learning algorithms struggled to accurately cluster short texts, potentially overlooking contextual subtleties. Lastly, using a limited number of X accounts further restricted the scope of findings. Future research could expand to diverse platforms (e.g., TikTok, Instagram) or include qualitative interviews to examine communicative strategies in diverse regional and cultural settings. Such expansions, both in timeframe and geographic coverage, would offer more comprehensive insights on evolving global public health communication and community engagement.
Conclusions
During the early COVID-19 pandemic, public health and news media organizations communicated six main topics: policies, methods, and action, case updates, opinions and responses, medical research and treatment information, impacts and consequences, and health instructions and suggestions. Public health organizations have maintained their leadership in policy development, medical research, and public health guidance, and the news media has played a key role in increasing public awareness and supporting medical research through case updates and real-time information dissemination. Overall, public engagement was higher with public health organizations. To enhance outreach, the use of concise language and fewer hashtags is recommended for factual posts and detailed content with more hashtags for advisory posts. This study offers insights for enhancing social media communication and public engagement during crises.
Data availability
The data supporting the findings of this study have been provided as requested.
References
-
Verma, A. K. & Prakash, S. Impact of covid-19 on environment and society. J. Glob. Biosci. 9 (5), 7352–7363 (2020).
-
Vindegaard, N. & Benros, M. E. COVID-19 pandemic and mental health consequences: systematic review of the current evidence. Brain. Behav. Immun. 89, 531–542 (2020).
-
McArthur, L. et al. Review of burden, clinical definitions, and management of COVID-19 cases. Am. J. Trop. Med. Hyg. 103 (2), 625 (2020).
-
Ning, L. et al. The impacts of knowledge, risk perception, emotion and information on citizens’ protective behaviors during the outbreak of COVID-19: a cross-sectional study in China. BMC Public. Health. 20 (1), 1751 (2020).
-
Hale, T. et al. Variation in Government Responses to COVID-19. (2020).
-
Anwar, A. et al. Role of mass media and public health communications in the COVID-19 pandemic. Cureus. 12(9). (2020).
-
Khan, M. S. et al. Using critical information to strengthen pandemic preparedness: the role of national public health agencies. BMJ Glob. Health. 5 (9), e002830 (2020).
-
Falagas, M. E. & Kiriaze, I. J. J. C. C. Reaction to the threat of influenza pandemic: the mass media and the public. 10(2), 1 (2006).
-
Organization, W. H. Overview of Public Health and Social Measures in the Context of COVID-19: Interim Guidance, 18 May 2020 (World Health Organization, 2020).
-
Choi, S. The two-step flow of communication in Twitter-based public forums. Social Sci. Comput. Rev. 33 (6), 696–711 (2015).
-
Christie, A. et al. Guidance for implementing COVID-19 prevention strategies in the context of varying community transmission levels and vaccination coverage. Morb. Mortal. Wkly. Rep. 70 (30), 1044 (2021).
-
Lin, H. C. & Chang, C. M. What motivates health information exchange in social media? The roles of the social cognitive theory and perceived interactivity. Inf. Manag. 55 (6), 771–780 (2018).
-
Thompson, J. D. Public health pedagogy and digital misinformation: Health professional influencers and the politics of expertise. J. Sociol. 59 (3), 646–663 (2022).
-
Civelek, M. E., Çemberci, M. & Eralp, N. E. The role of social media in crisis communication and crisis management. Int. J. Res. Bus. Social Sci. 5(3). (2016).
-
Schillinger, D., Chittamuru, D. & Ramírez, A. S. From infodemics to health promotion: a novel framework for the role of social media in public health. Am. J. Public Health. 110 (9), 1393–1396 (2020).
-
Fung, I. C. H., Tse, Z. T. H. & Fu, K. W. The use of social media in public health surveillance. Western Pac. Surveill. Response J. WPSAR. 6 (2), 3 (2015).
-
Eke, P. I. Using social media for research and public health surveillance. J. Dent. Res. 90 (9), 1045 (2011).
-
Muhammed, T., Mathew, S. K. & S. and The disaster of misinformation: a review of research in social media. Int. J. Data Sci. Anal.. 13 (4), 271–285 (2022).
-
Gorodnichenko, Y., Pham, T. & Talavera, O. Social media, sentiment and public opinions: evidence from# brexit and# USElection. Eur. Econ. Rev. 136, 103772 (2021).
-
MacKay, M. et al. Examining social media crisis communication during early COVID-19 from public health and news media for quality, content, and corresponding public sentiment. Int. J. Environ. Res. Public Health. 18 (15), 7986 (2021).
-
Yu, H. et al. Emotion diffusion effect: negative sentiment COVID-19 tweets of public organizations attract more responses from followers. PloS One. 17 (3), e0264794 (2022).
-
Li, L. et al. Characterizing the propagation of situational information in social media during covid-19 epidemic: a case study on weibo. IEEE Trans. Comput. Soc. Syst. 7 (2), 556–562 (2020).
-
Boon-Itt, S. & Skunkan, Y. Public perception of the COVID-19 pandemic on Twitter: sentiment analysis and topic modeling study. JMIR Public. Health Surveill. 6 (4), e21978 (2020).
-
Tandoc, E. C. Jr, Lim, D. & Ling, R. Diffusion of disinformation: how social media users respond to fake news and why. Journalism 21 (3), 381–398 (2020).
-
Rossini, P. et al. Dysfunctional information sharing on WhatsApp and Facebook: the role of political talk, cross-cutting exposure and social corrections. New. Media Soc. 23 (8), 2430–2451 (2021).
-
Jünger, J. & Fähnrich, B. Does Really no one care? Analyzing the Public Engagement of Communication Scientists on Twitter 387–408 (New Media & Society, 2020).
-
Othman, S. S. et al. Association between social media use and the acceptance of COVID-19 vaccination among the general population in Saudi Arabia—a cross-sectional study. BMC Public. Health. 22 (1), 1–11 (2022).
-
Elbarazi, I. et al. The impact of the COVID-19 Infodemic on well-being: a cross-sectional study. J. Multidiscip. Healthc. 15, 289 (2022).
-
D’Souza, R. S., Kilgore, A. E. & D’Souza, S. Manifestations of Pain during the COVID-19 pandemic portrayed on social media: a cross-sectional study. Pain Med. 23 (2), 229–233 (2022).
-
Jaspal, R. & Breakwell, G. M. Social support, perceived risk and the likelihood of COVID-19 testing and vaccination: cross-sectional data from the United Kingdom. Curr. Psychol. 41 (1), 492–504 (2022).
-
Li, J. et al. Data mining and content analysis of the Chinese social media platform Weibo during the early COVID-19 outbreak: retrospective observational infoveillance study. JMIR Public. Health Surveill.. 6 (2), e18700 (2020).
-
Rai, R. K. et al. Impact of social media advertisements on the transmission dynamics of COVID-19 pandemic in India. J. Appl. Math. Comput. 68 (1), 19–44 (2022).
-
Hussain, Z. et al. Artificial intelligence–enabled social media analysis for pharmacovigilance of COVID-19 vaccinations in the United Kingdom: observational study. JMIR Public. Health Surveill.. 8 (5), e32543 (2022).
-
Song, T., Qian, S. & Yu, P. Mobile health interventions for self-control of unhealthy alcohol use: systematic review. JMIR Mhealth Uhealth. 7 (1), e10899 (2019).
-
Kudchadkar, S. R. & Carroll, C. L. Using social media for rapid information dissemination in a pandemic: #PedsICU and coronavirus disease 2019. Pediatr. Crit. Care Med. 21 (8), e538–e546 (2020).
-
McCombs, M. E., Shaw, D. L. & Weaver, D. H. New Directions in agenda-setting Theory and Research, in Advances in Foundational Mass Communication Theories 131–152 (Routledge, 2018).
-
Russell Neuman, W. et al. The dynamics of public attention: agenda-setting theory meets big data. J. Commun.. 64 (2), 193–214 (2014).
-
Ng, R., Chow, T. Y. J. & Yang, W. News media narratives of Covid-19 across 20 countries: early global convergence and later regional divergence. PLoS One. 16 (9), e0256358 (2021).
-
Buturoiu, D. R. & Voloc, A. Media Coverage in Times of Crisis. Intermedia Agenda-setting of COVID-19–related topics. Rom. J. Commun. Public. Relat.. 23 (2), 7–22 (2021).
-
Ren, S. et al. Public opinion communication mechanism of public health emergencies in Weibo: take the COVID-19 epidemic as an example. Front. Public. Health. 11 (2023).
-
Wang, Q. Using social media for agenda setting in Chinese government’s communications during the 2020 COVID-19 pandemic. J. Commun. Inq. 46 (4), 373–394 (2022).
-
Mach, K. J. et al. News media coverage of COVID-19 public health and policy information. Humanit. Social Sci. Commun. 8 (1), 220 (2021).
-
Coombs, W. T. Revising situational crisis communication theory. Social Media Crisis Commun.. 1, 21–37 (2017).
-
Coombs, W. T., Holladay, S. J. & White, K. L. Situational crisis communication theory (SCCT) and application in dealing with complex, challenging, and recurring crises. In Advancing Crisis Communication Effectiveness: Integrating Public Relations Scholarship with Practice 15 (2020).
-
Holladay, S. J. Crisis communication strategies in the media coverage of chemical accidents. J. Public. Relat. Res. 21 (2), 208–217 (2009).
-
Smith, B. G. Socially distributing public relations: Twitter, Haiti, and interactivity in social media. Public. Relat. Rev. 36 (4), 329–335 (2010).
-
Shao, G. Understanding the Appeal of User-Generated Media: A Uses and Gratification Perspective (Internet Research, 2009).
-
Tenenboim, O. Comments, shares, or likes: what makes news posts engaging in different ways. Social Media + Soc. 8 (4), 20563051221130282 (2022).
-
Kim, J. & Yoo, J. Role of sentiment in message propagation: Reply vs. retweet behavior in political communication. in 2012 International Conference on Social Informatics (IEEE, 2012).
-
Skoric, M. M., Ying, D. & Ng, Y. Bowling online, not alone: online social capital and political participation in Singapore. J. Comput.-Mediat. Commun.. 14 (2), 414–433 (2009).
-
Hodson, J. N. What Social Media Likes: A Discourse Analysis of the Google, Facebook and Twitter Blogs. (2013).
-
Ruggiero, T. E. Uses and gratifications theory in the 21st century. Mass. Commun. Soc. 3 (1), 3–37 (2000).
-
Coombs, W. T. & Laufer, D. Global Crisis management—current research and future directions. J. Int. Manag. 24 (3), 199–203 (2018).
-
Howell, G. & Miller, R. How the relationship between the crisis life cycle and mass media content can better inform crisis communication. PRism 4 (1), 1–14 (2006).
-
Martin, A. J. et al. Motivation and engagement in the United States, Canada, United Kingdom, Australia, and China: testing a multi-dimensional framework. J. Psychoeduc. Assess. 33 (2), 103–114 (2015).
-
Rothstein, H. et al. True to type? How Governance Traditions Shaped Responses to Covid-19 in China, Germany, UK, and USA, in Covid-19 and the Sociology of Risk and Uncertainty: Studies of Social Phenomena and Social Theory Across 6 Continents 115–143 (Springer, 2022).
-
Fisk, M., Livingstone, A. & Pit, S. W. Telehealth in the context of COVID-19: changing perspectives in Australia, the United Kingdom, and the United States. J. Med. Internet. Res. 22 (6), e19264 (2020).
-
Bian, Y., Hao, M. & Li, Y. Social networks and subjective well-being: a comparison of Australia, Britain, and China. J. Happiness Stud. 19, 2489–2508 (2018).
-
Mellon, J. & Prosser, C. Twitter and Facebook are not representative of the general population: political attitudes and demographics of British social media users. Res. Politics. 4 (3), 2053168017720008 (2017).
-
Tsao, S. F. et al. What social media told us in the time of COVID-19: a scoping review. Lancet Digit. Health. 3 (3), e175–e194 (2021).
-
Sohail, S. S. et al. Crawling Twitter data through API: A technical/legal perspective. arXiv preprint arXiv:2105.10724 (2021).
-
RStudioTeam RStudio: Integrated Development Environment for R. Boston, MA. (2016).
-
Cohen, J. Statistical power analysis. Curr. Dir. Psychol. Sci. 1 (3), 98–101 (1992).
-
Wu, H. H. et al. Say their names: resurgence in the collective attention toward Black victims of fatal police violence following the death of George Floyd. PLoS One. 18 (1), e0279225 (2023).
-
Welbers, K., Van Atteveldt, W. & Benoit, K. Text analysis in R. Commun. Methods Meas.. 11 (4), 245–265 (2017).
-
Pennington, J., Socher, R. & Manning, C. D. Glove: Global vectors for word representation. In Proceedings of the Conference on Empirical Methods in Natural Language Processing (EMNLP). 2014. (2014).
-
Xu, X. et al. Review of classical dimensionality reduction and sample selection methods for large-scale data processing. Neurocomputing 328, 5–15 (2019).
-
Onan, A. Sentiment analysis on product reviews based on weighted word embeddings and deep neural networks. Concurr. Comput. Pract. Exp.. 33 (23), e5909 (2021).
-
Xu, J. et al. Self-taught convolutional neural networks for short text clustering. Neural Netw. 88, 22–31 (2017).
-
He, T. et al. Text-attentional convolutional neural network for scene text detection. IEEE Trans. Image Process. 25 (6), 2529–2541 (2016).
-
Hu, Y. et al. Short text classification with a convolutional neural networks based method. In 15th International Conference on Control, Automation, Robotics and Vision (ICARCV) (IEEE, 2018).
-
Sinaga, K. P. & Yang, M. S. Unsupervised K-means clustering algorithm. IEEE Access. 8, 80716–80727 (2020).
-
Humaira, H. & Rasyidah, R. Determining the appropriate cluster number using Elbow method for K-Means algorithm. In Proceedings of the 2nd Workshop on Multidisciplinary and Applications (WMA). (2020).
-
Sokolova, M., Japkowicz, N. & Szpakowicz, S. Beyond accuracy, F-score and ROC: a family of discriminant measures for performance evaluation. In Australasian Joint Conference on Artificial Intelligence. (Springer, 2006).
-
Vaismoradi, M. et al. Theme Dev. Qualitative Content Anal. Thematic Anal. (2016).
-
Dehak, N. et al. Cosine similarity scoring without score normalization techniques. In Odyssey (2010).
-
Kaefer, F., Roper, J. & Sinha, P. N. A software-assisted qualitative content analysis of news articles: Examples and reflections. (2015).
-
Song, T. et al. A comprehensive 6A framework for improving patient self-management of hypertension using mHealth services: qualitative thematic analysis. J. Med. Internet. Res. 23 (6), e25522 (2021).
-
Dierenfeld, H. & Merceron, A. Learning Analytics with Excel Pivot Table (2012).
-
Ostertagova, E., Ostertag, O. & Kováč, J. Methodology and application of the Kruskal–Wallis test. In Applied Mechanics and Materials. (Trans Tech Publ., 2014).
-
Singh, N. U. et al. Non Parametric Tests: Hands on SPSS (ICAR Research Complex for NEH Region, Umiam, 2013).
-
Takahashi, K. et al. Confidence interval for micro-averaged F1 and macro-averaged F1 scores. Appl. Intell. 52 (5), 4961–4972 (2022).
-
Gao, Y., Xie, Z. & Li, D. Electronic cigarette users’ perspective on the COVID-19 pandemic: Observational Study using Twitter Data. JMIR Public. Health Surveill.. 7 (1), e24859 (2021).
-
Yang, S. et al. Analysis and insights for myths circulating on Twitter during the COVID-19 pandemic. IEEE Open. J. Comput. Soc. 1, 209–219 (2020).
-
He, L. et al. Why do people oppose mask wearing? A comprehensive analysis of U.S. tweets during the COVID-19 pandemic. J. Am. Med. Inform. Assoc. 28 (7), 1564–1573 (2021).
-
Shiri, I. et al. COLI-Net: deep learning‐assisted fully automated COVID‐19 lung and infection pneumonia lesion detection and segmentation from chest computed tomography images. Int. J. Imaging Syst. Technol. 32 (1), 12–25 (2022).
-
Olsson, E. K. Crisis communication in public organisations: dimensions of crisis communication revisited. J. Contingencies Crisis Manag. 22 (2), 113–125 (2014).
-
Marres, N. & Moats, D. Mapping controversies with social media: the case for symmetry. Soc. Media + Soc. 1 (2), 2056305115604176 (2015).
-
Lee, J. et al. Whose advantage? Measuring attention dynamics across youtube and twitter on controversial topics. In Proceedings of the International AAAI Conference on Web and Social Media. (2022).
-
Shahbazi, M. Information Communication Technology for Crisis Management and Shared Situational Awareness: Social Media Public Health Communication During the COVID-19 Pandemic. (2023).
-
Mansoor, M. Citizens’ trust in government as a function of good governance and government agency’s provision of quality information on social media during COVID-19. Government Inform. Q. 38 (4), 101597 (2021).
-
Xu, Q. et al. Characterizing Weibo social media posts from Wuhan, China during the early stages of the COVID-19 pandemic: qualitative content analysis. JMIR Public. Health Surveill.. 6 (4), e24125 (2020).
-
Gao, Q. et al. A comparative study of users’ microblogging behavior on Sina Weibo and Twitter. In International Conference on User Modeling, Adaptation, and Personalization. (Springer, 2012).
-
Lee, O. K. D. et al. The role of information technologies in crises: a review and conceptual development of IT-enabled agile crisis management. Commun. Assoc. Inform. Syst. 50 (1), 32 (2022).
-
Stieglitz, S. et al. The Adoption of Social Media Analytics for Crisis Management—Challenges and Opportunities. (2018).
Acknowledgements
The authors thank Dr. Hong Chen and Siyu Chen for manually coding the tweets. We acknowledge the Australian & New Zealand Communication Association (ANZCA) for facilitating the space to germinate some of the ideas for this study at their 2022 conference, which was themed “Communicating through Chaos: Connection, Disruption, Community”.
Author information
Authors and Affiliations
Contributions
P.Y. conceived the study, H.Y. collected the data, and T.S., P.Y., and J.K. analyzed the results. T.S. prepared the initial draft, and T.S., P.Y., and B.Y. critically reviewed and revised the manuscript. All authors have read and approved the final version for publication.
Corresponding author
Ethics declarations
Competing interests
The authors declare no competing interests.
Additional information
Publisher’s note
Springer Nature remains neutral with regard to jurisdictional claims in published maps and institutional affiliations.
Electronic supplementary material
Below is the link to the electronic supplementary material.
Rights and permissions
Open Access This article is licensed under a Creative Commons Attribution-NonCommercial-NoDerivatives 4.0 International License, which permits any non-commercial use, sharing, distribution and reproduction in any medium or format, as long as you give appropriate credit to the original author(s) and the source, provide a link to the Creative Commons licence, and indicate if you modified the licensed material. You do not have permission under this licence to share adapted material derived from this article or parts of it. The images or other third party material in this article are included in the article’s Creative Commons licence, unless indicated otherwise in a credit line to the material. If material is not included in the article’s Creative Commons licence and your intended use is not permitted by statutory regulation or exceeds the permitted use, you will need to obtain permission directly from the copyright holder. To view a copy of this licence, visit http://creativecommons.org/licenses/by-nc-nd/4.0/.
About this article

Cite this article
Song, T., Yu, P., Yecies, B. et al. Social media crisis communication and public engagement during COVID-19 analyzing public health and news media organizations’ tweeting strategies.
Sci Rep 15, 18082 (2025). https://doi.org/10.1038/s41598-025-90759-w
-
Received:
-
Accepted:
-
Published:
-
DOI: https://doi.org/10.1038/s41598-025-90759-w
Keywords
This post was originally published on this site be sure to check out more of their content