Norovirus is currently considered the leading cause of acute gastroenteritis worldwide (1). Clustering among children in schools can easily lead to norovirus outbreaks (2). Rapid and effective control of such outbreaks in schools remains a significant public health challenge (3). Norovirus spread should be regarded as a diffusion behavior in social networks and as a dynamic, continuously evolving process. Social network analysis, as a highly flexible research method, can recognize the inherent complexity of individuals’ connections. By simulating the transmission dynamics of social networks based on a norovirus outbreak in a primary school, 12 key nodes were identified during the spread and recession periods. This approach demonstrated that targeted control strategies, which transcend inherent epidemiological approaches, are effective and provide insights for emergency management.
Using data from a norovirus outbreak reported in a Zhuhai City primary school (4), the epidemic lifecycle — from emergence to spread and decline — was analyzed. A 63×63 transmission matrix was constructed for all nodes. Network analysis and characteristic parameter calculation were performed using UCINET (version 6.528, Analytic Technologies, USA). NetLogo (version 3D 6.1.1, Northwestern’s Center for Connected Learning and Computer-Based Modeling, USA) was used to model and simulate the effects of interventions during different epidemic periods. Methods for social network analysis and modeling are described in
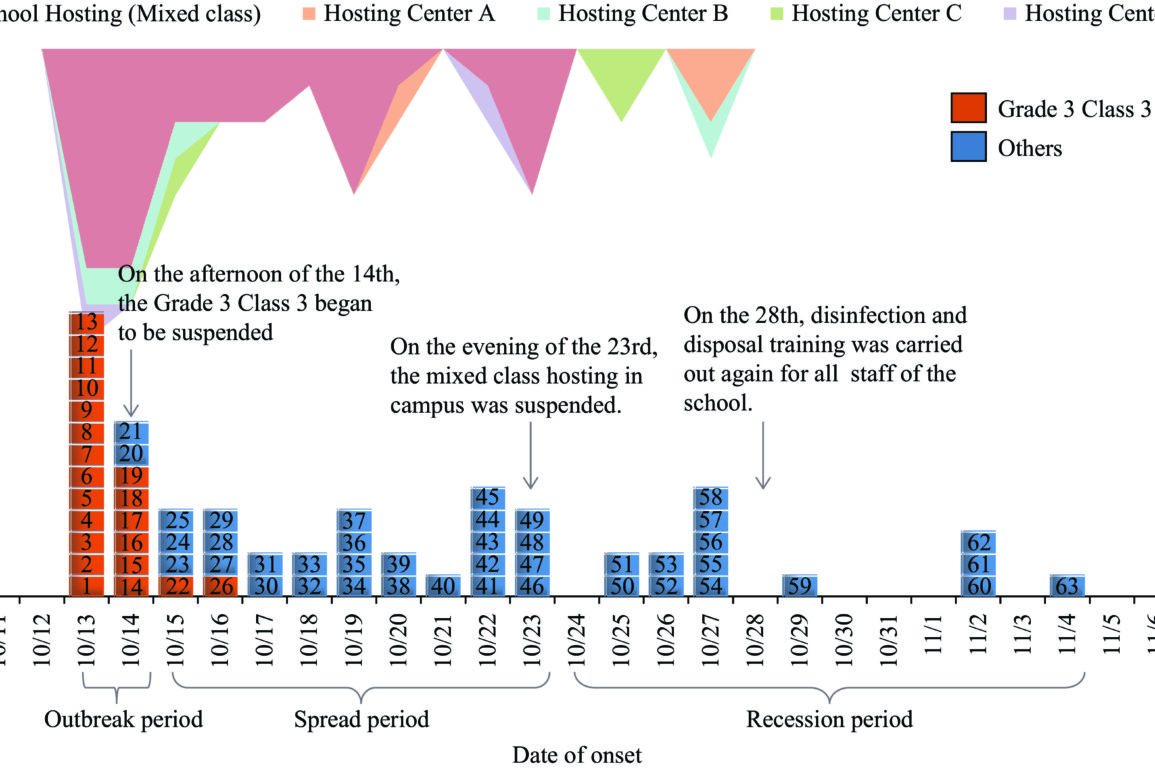
The norovirus outbreak lasted 23 days, with 63 total cases reported across 6 grades and 18 classes. The class attack rate ranged from 1.96% (1/51) to 42.9% (21/49), and the overall attack rate was 4.2% (63/1,500). The outbreak initially affected 21 cases (Cases 1–21) in 3 classes over 2 days. This initial outbreak was primarily concentrated in Grade 3, Class 3, involving 19 cases, including the index case who experienced vomiting in the classroom on October 13, 2020. The incidence curve indicated a point-source exposure pattern. On October 14, classes for Grade 3, Class 3 were suspended. However, the epidemic continued with a spreading period involving 28 cases (Cases 22–49) across 13 classes over 9 days, suggesting a person-to-person transmission model. On-campus housing was suspended until the evening of October 23. On October 24, a recession period began, involving 14 cases (Cases 50–63) in 10 classes. This period lasted 12 days, and the epidemic curve showed a tailing pattern (Figure 1).
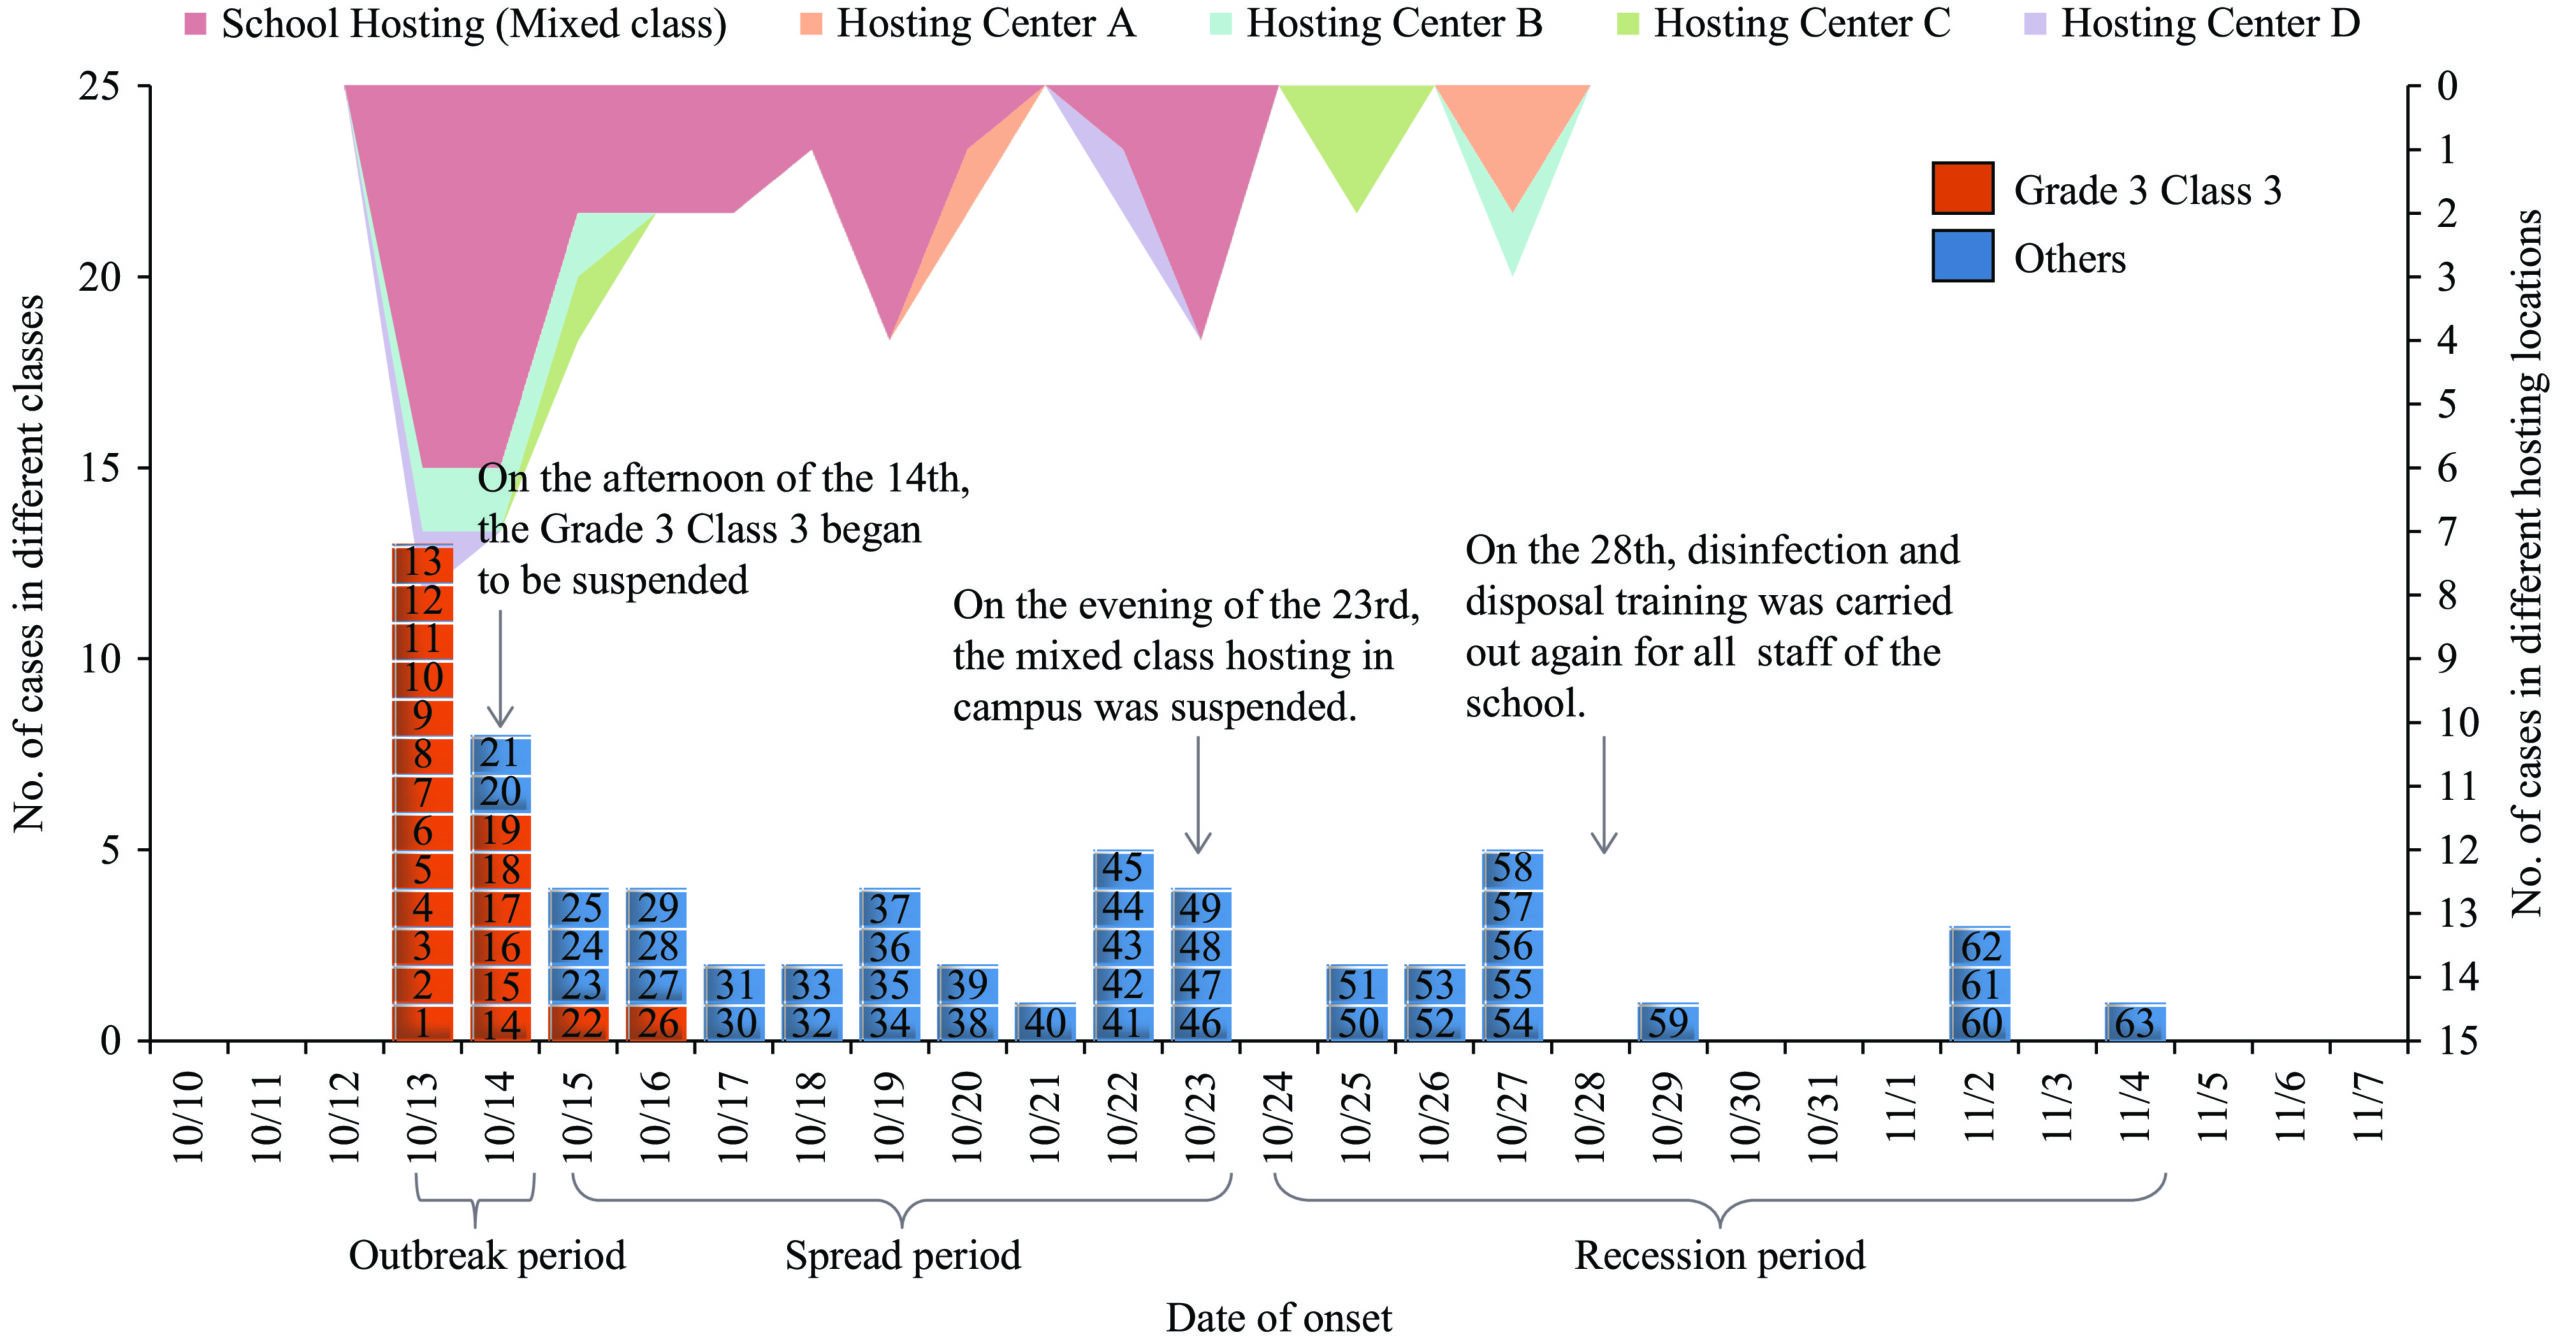
The onset date in different classes and hosting locations and periods of development of a norovirus outbreak at a primary school in Zhuhai City, Guangdong Province, China, 2023.
A rapid point-source outbreak occurred in Grade 3, Class 3, with 10 (Cases 2, 5, 7, 11–15, 19, and 20) of the 21 reported cases involved in mixed-class hosting at the school on October 13 and 14, 2020. This activity resulted in the direct infection of 19 students in other classes. The outbreak spread further to the classes of these students and through off-campus hosting centers. Case 23, which was hosted at hosting centers B and C at midday and in the evening, may have caused internal transmission at these two centers. None of the reported cases in Grade 3, Class 3, were cared for at hosting centers A and C. These two centers had longer transmission chains. Additionally, Case 9 in Grade 3, Class 3, and Case 43 in Grade 6, Class 2, were both at hosting center D; however, their 8-day onset time interval suggests latent infections within the network as possible sources or bridges of infection. Notably, Case 61 in Grade 6, Class 3, had no clear social relationships within the network (Figure 2).
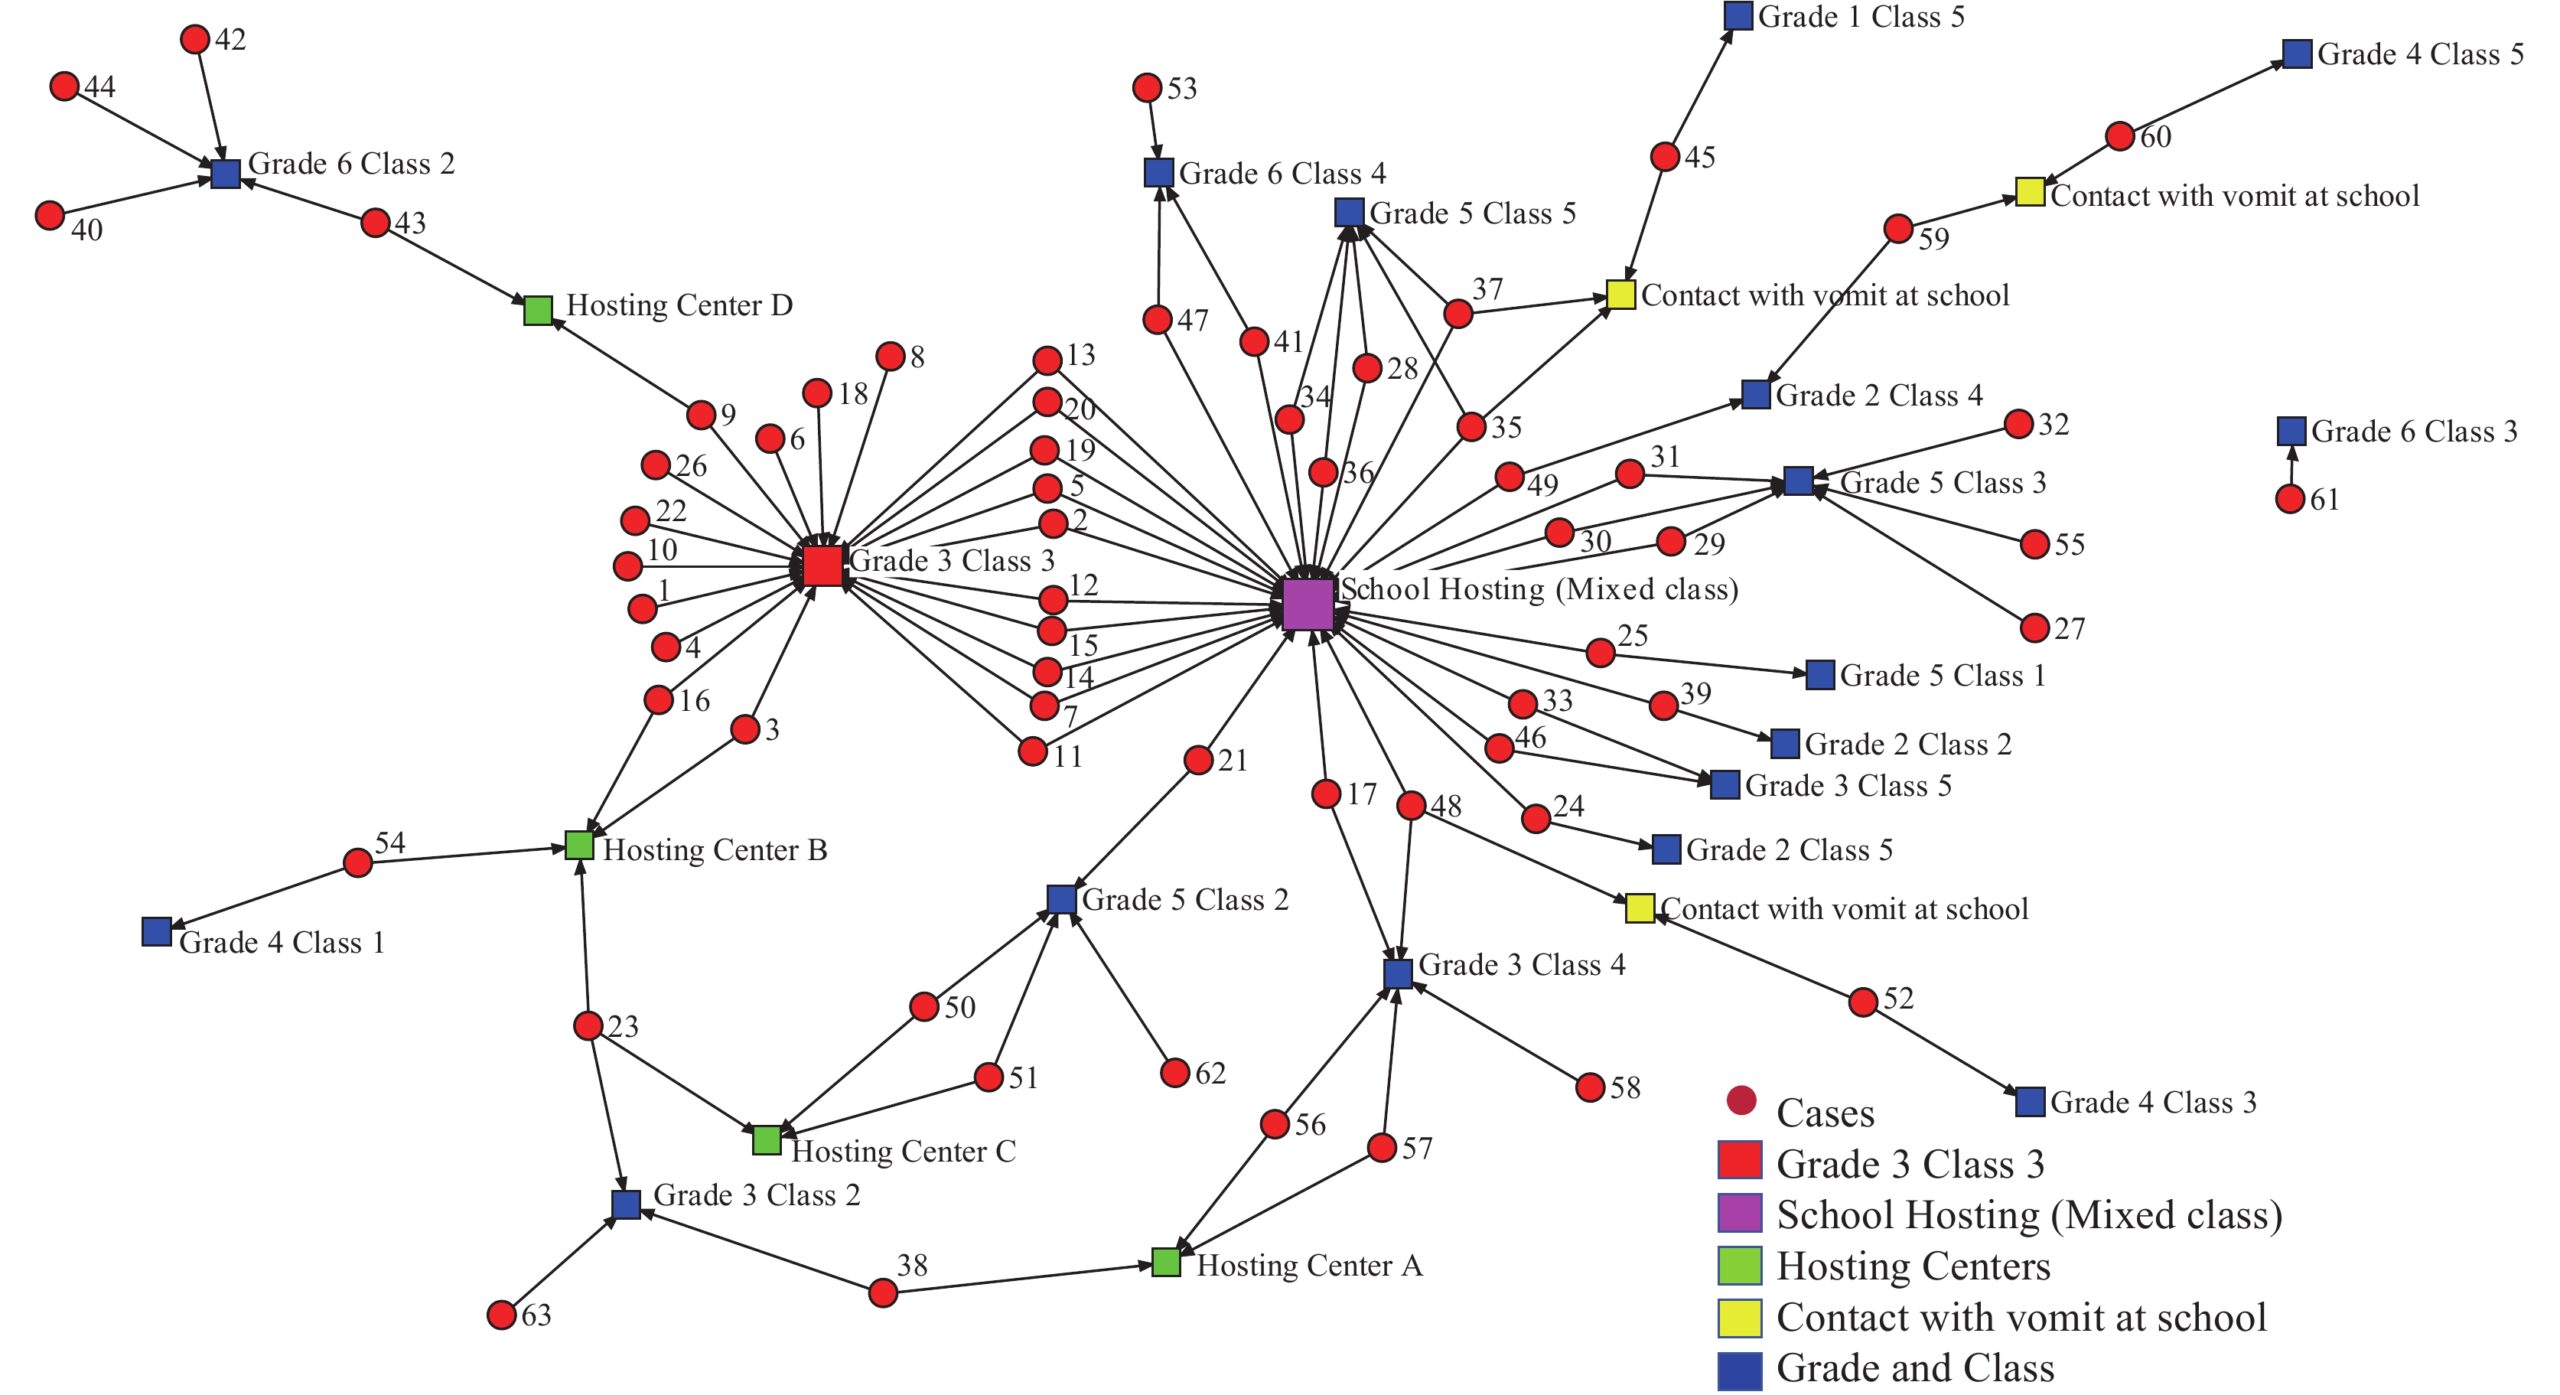
The social network topology of 63 cases of a norovirus outbreak at a primary school in Zhuhai City, Guangdong Province, China, 2023.
During the outbreak period, the network was the tightest (density=0.871), with 10 main key nodes (cases 2, 5, 7, 11–15, 19, and 20), which were included in 17 core nodes, as shown by the core-periphery analysis results. The average distance between nodes in the outbreak period was 1.085, meaning any two nodes could communicate through an average of 1.1 intermediate nodes. During the spread period, network tightness decreased (density=0.495), and cases 9, 43, 23, 3, 16, 2/5/7/11–15/19/20 had greater betweenness centralization, meaning they were in a relatively central position in the network. During the recession period, the network was relatively loose (density=0.099). Five core nodes (41, 46–49) were in the core matrix, and cases 48 and 59 were the key nodes as the spread of vomiting according to social network topology. The degree and closeness centralization indicators of the whole network both point to key nodes 2, 5, 7, 11–15, 19, and 20. The average distance was 2.292, and 29 of the 63 cases were in the core matrix (Table 1, Figure 3).
| Period | Density | Degree centralization | Betweenness centralization | Closeness centralization | Average distance | Core-periphery | ||
| Out | In | Out | In | |||||
| Outbreak | 0.871 | 0.083 | 0.135 | 0.005 | 0.502 | 0.890 | 1.085 | 17 core nodes: 2–9, 11–16, 18–20 |
| Rank 1–10: 2, 5, 7, 11, 12, 13, 14, 15, 19, 20 | ||||||||
| Spread | 0.495 | 0.303 | 0.324 | 0.139 | 0.274 | 0.579 | 1.793 | 27 core nodes: 2, 5, 7, 11–15, 19–21, 24, 25, 28–31, 33–37, 39, 41, 46, 47, 49 |
| Rank 1–10: 2, 5, 7, 11, 12, 13, 14, 15, 19, 20 | Rank 1–10: 9, 43, 23, 3, 16, 2/5/7/11–15/19/20 | Rank 1–10: 2, 5, 7, 11, 12, 13, 14, 15, 19, 20 | ||||||
| Recession | 0.099 | 0.229 | 0.324 | 0.119 | 0.666 | 0.664 | 2.292 | 5 core nodes: 41, 46–49 |
| Rank 1–10: 48, 47, 41, 49, 53, 46, 56, 42, 58, 57 | Rank 1–7: 48, 53, 49, 42, 41, 47, 59; Other node: 0 | Rank 1–10: 52, 53, 41, 47, 48, 49, 46, 60, 56/57/58 | Rank 1–10: 42, 43, 44, 48, 49, 41, 47, 46, 56/57/58 | |||||
| Whole network | 0.314 | 0.304 | 0.320 | 0.085 | 0.125 | 0.306 | 2.100 | 29 core nodes: 2, 5, 7, 11–15, 17, 19–21, 24, 25, 28–31, 33–37, 39, 41, 46–49 |
| Rank 1–10: 2, 5, 7, 11, 12, 13, 14, 15, 19, 20 | Rank 1–10: 9, 43, 23, 48, 3, 16, 17, 49, 21, 29/31/30 | Rank 1–10: 2, 5, 7, 11, 12, 13, 14, 15, 19, 20 | ||||||
Table 1.
The social network characteristic parameters and key nodes of different periods of development of a norovirus outbreak at a primary school in Zhuhai City, Guangdong Province, China, 2023.
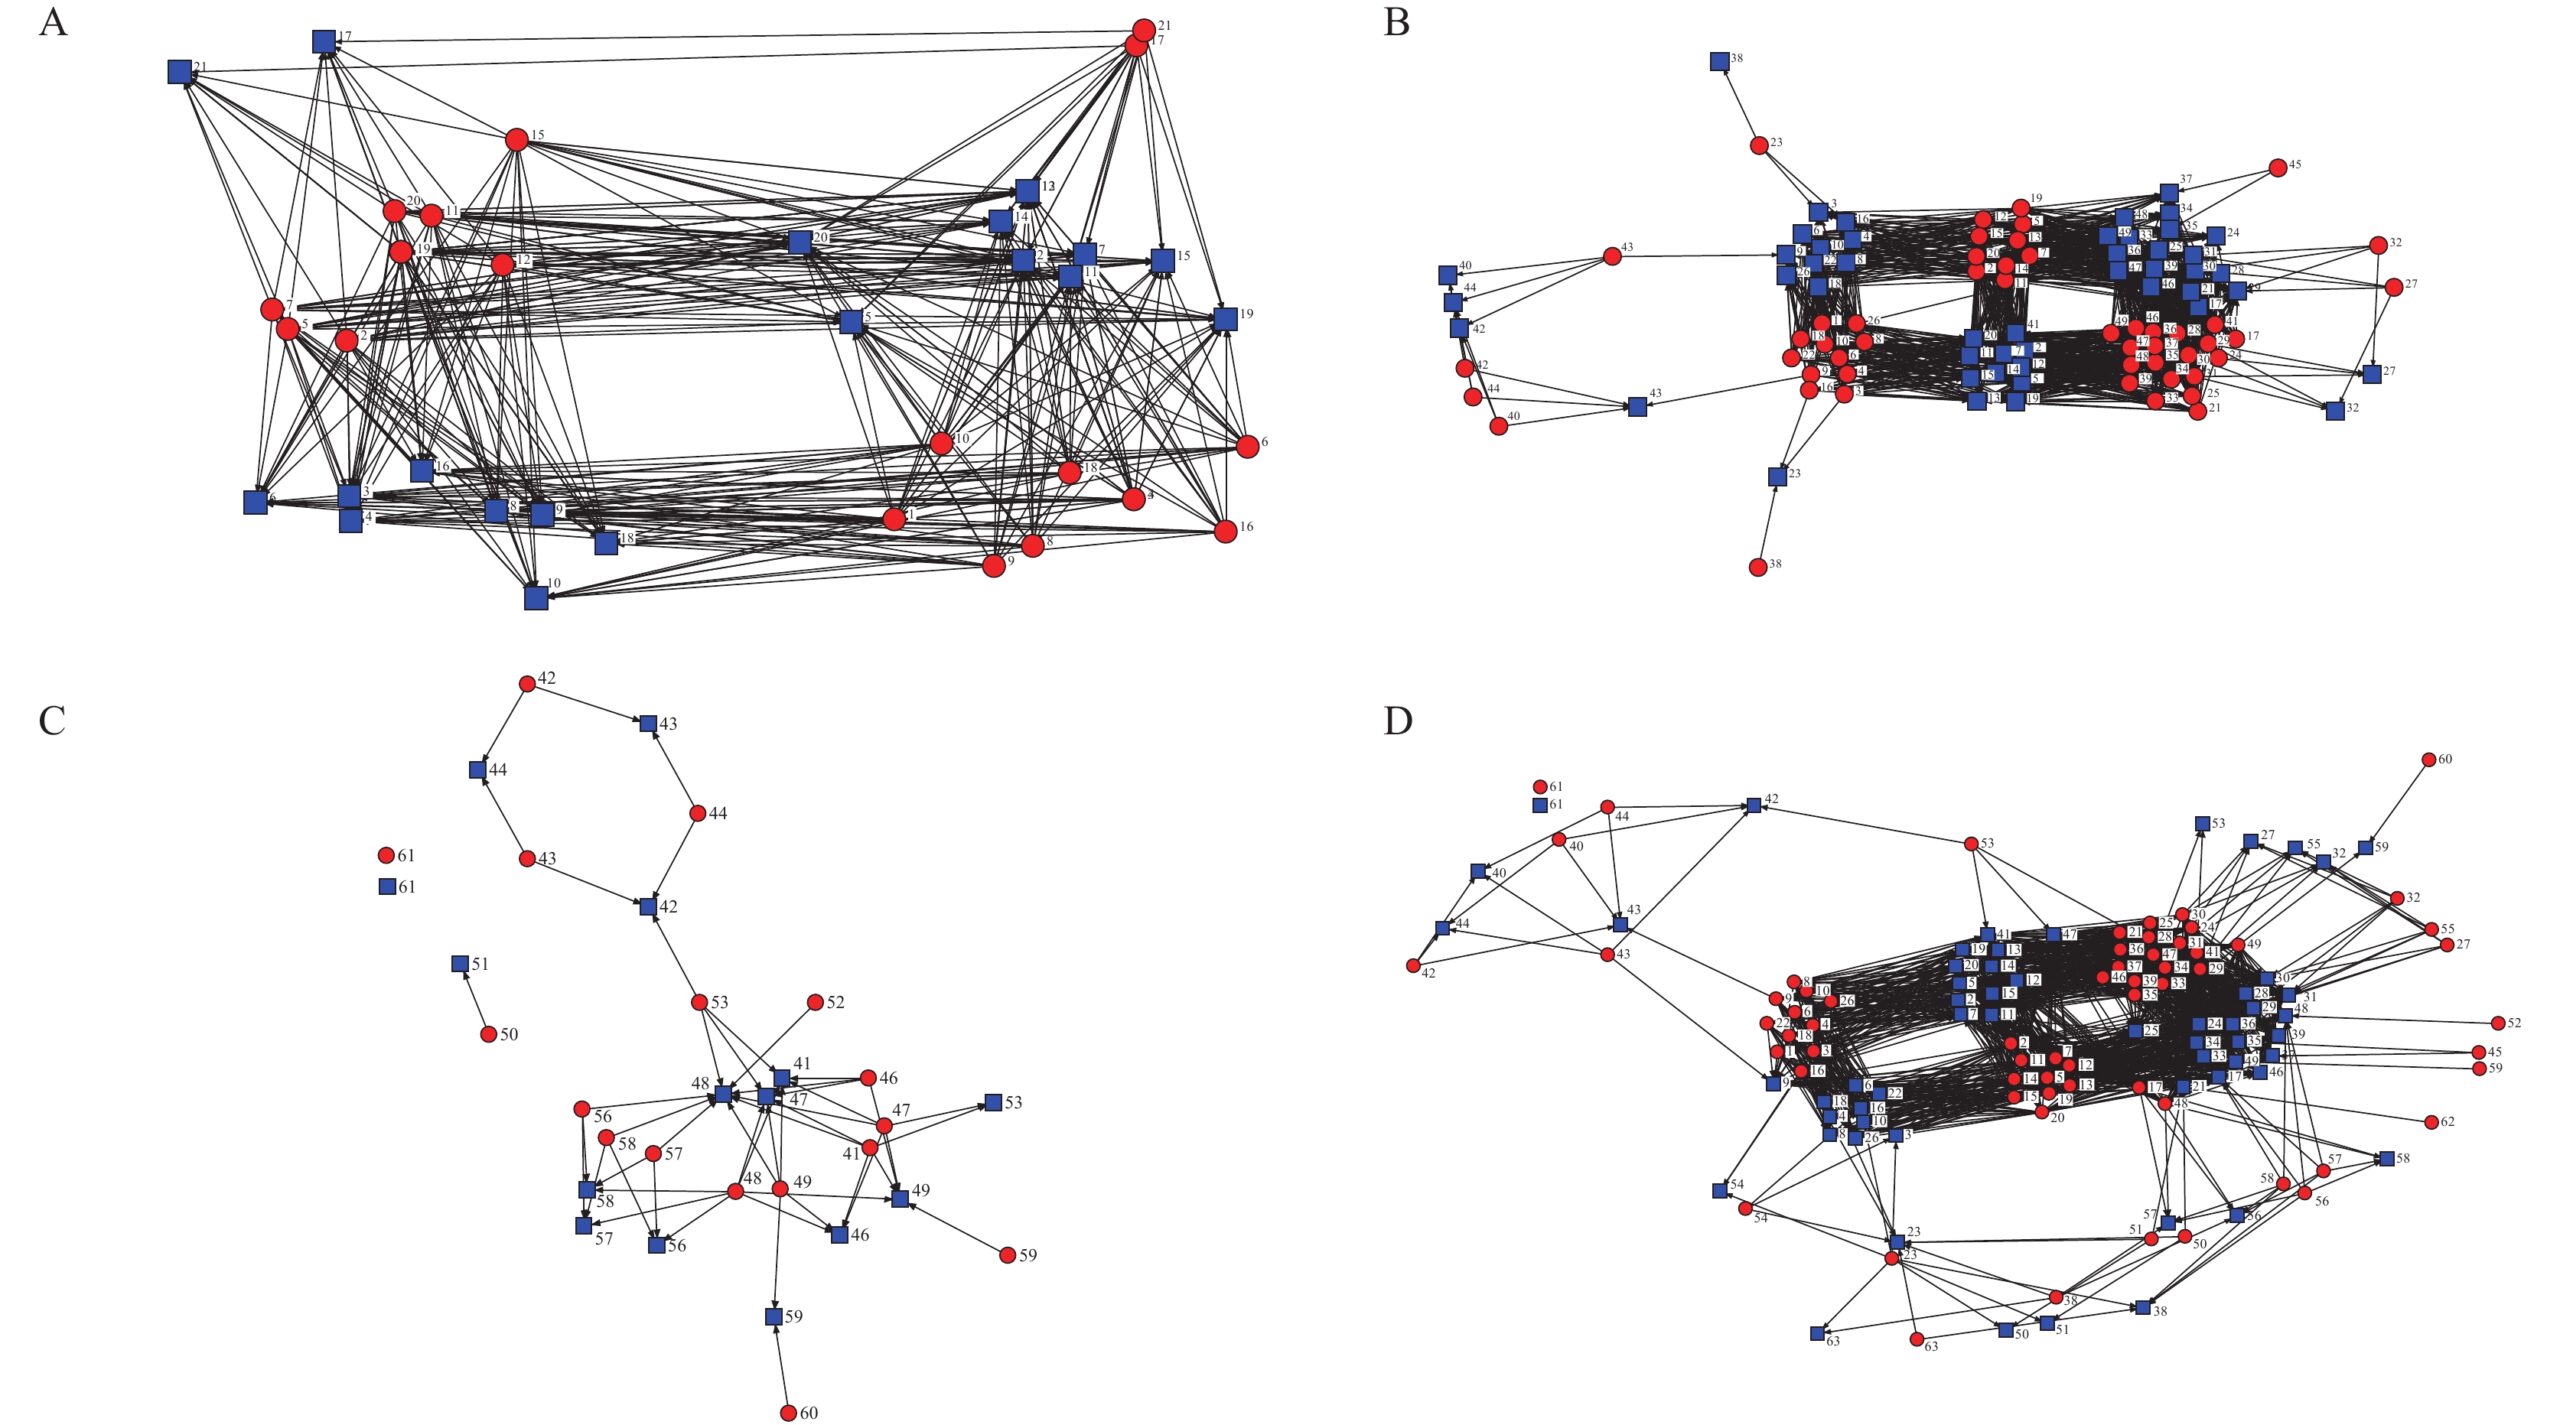
The social network matrix of different periods of development of a norovirus outbreak at a primary school in Zhuhai City, Guangdong Province, China, 2023. (A) Outbreak; (B) Spread; (C) Recession; (D) Whole network.
The curve generated with 10 randomly controlled nodes (decay step length=1,083) was similar to the curve generated without controlling any nodes (1,091). Controlling 10 key nodes (2, 5, 7, 11–15, 19, and 20) and eliminating the factors of mixed-class hosting at school significantly reduced the step length of the curve (819). Eliminating the key nodes (48,59) are controlling the spread of vomiting during the recession period further reduced the step length (680) (Figure 4).
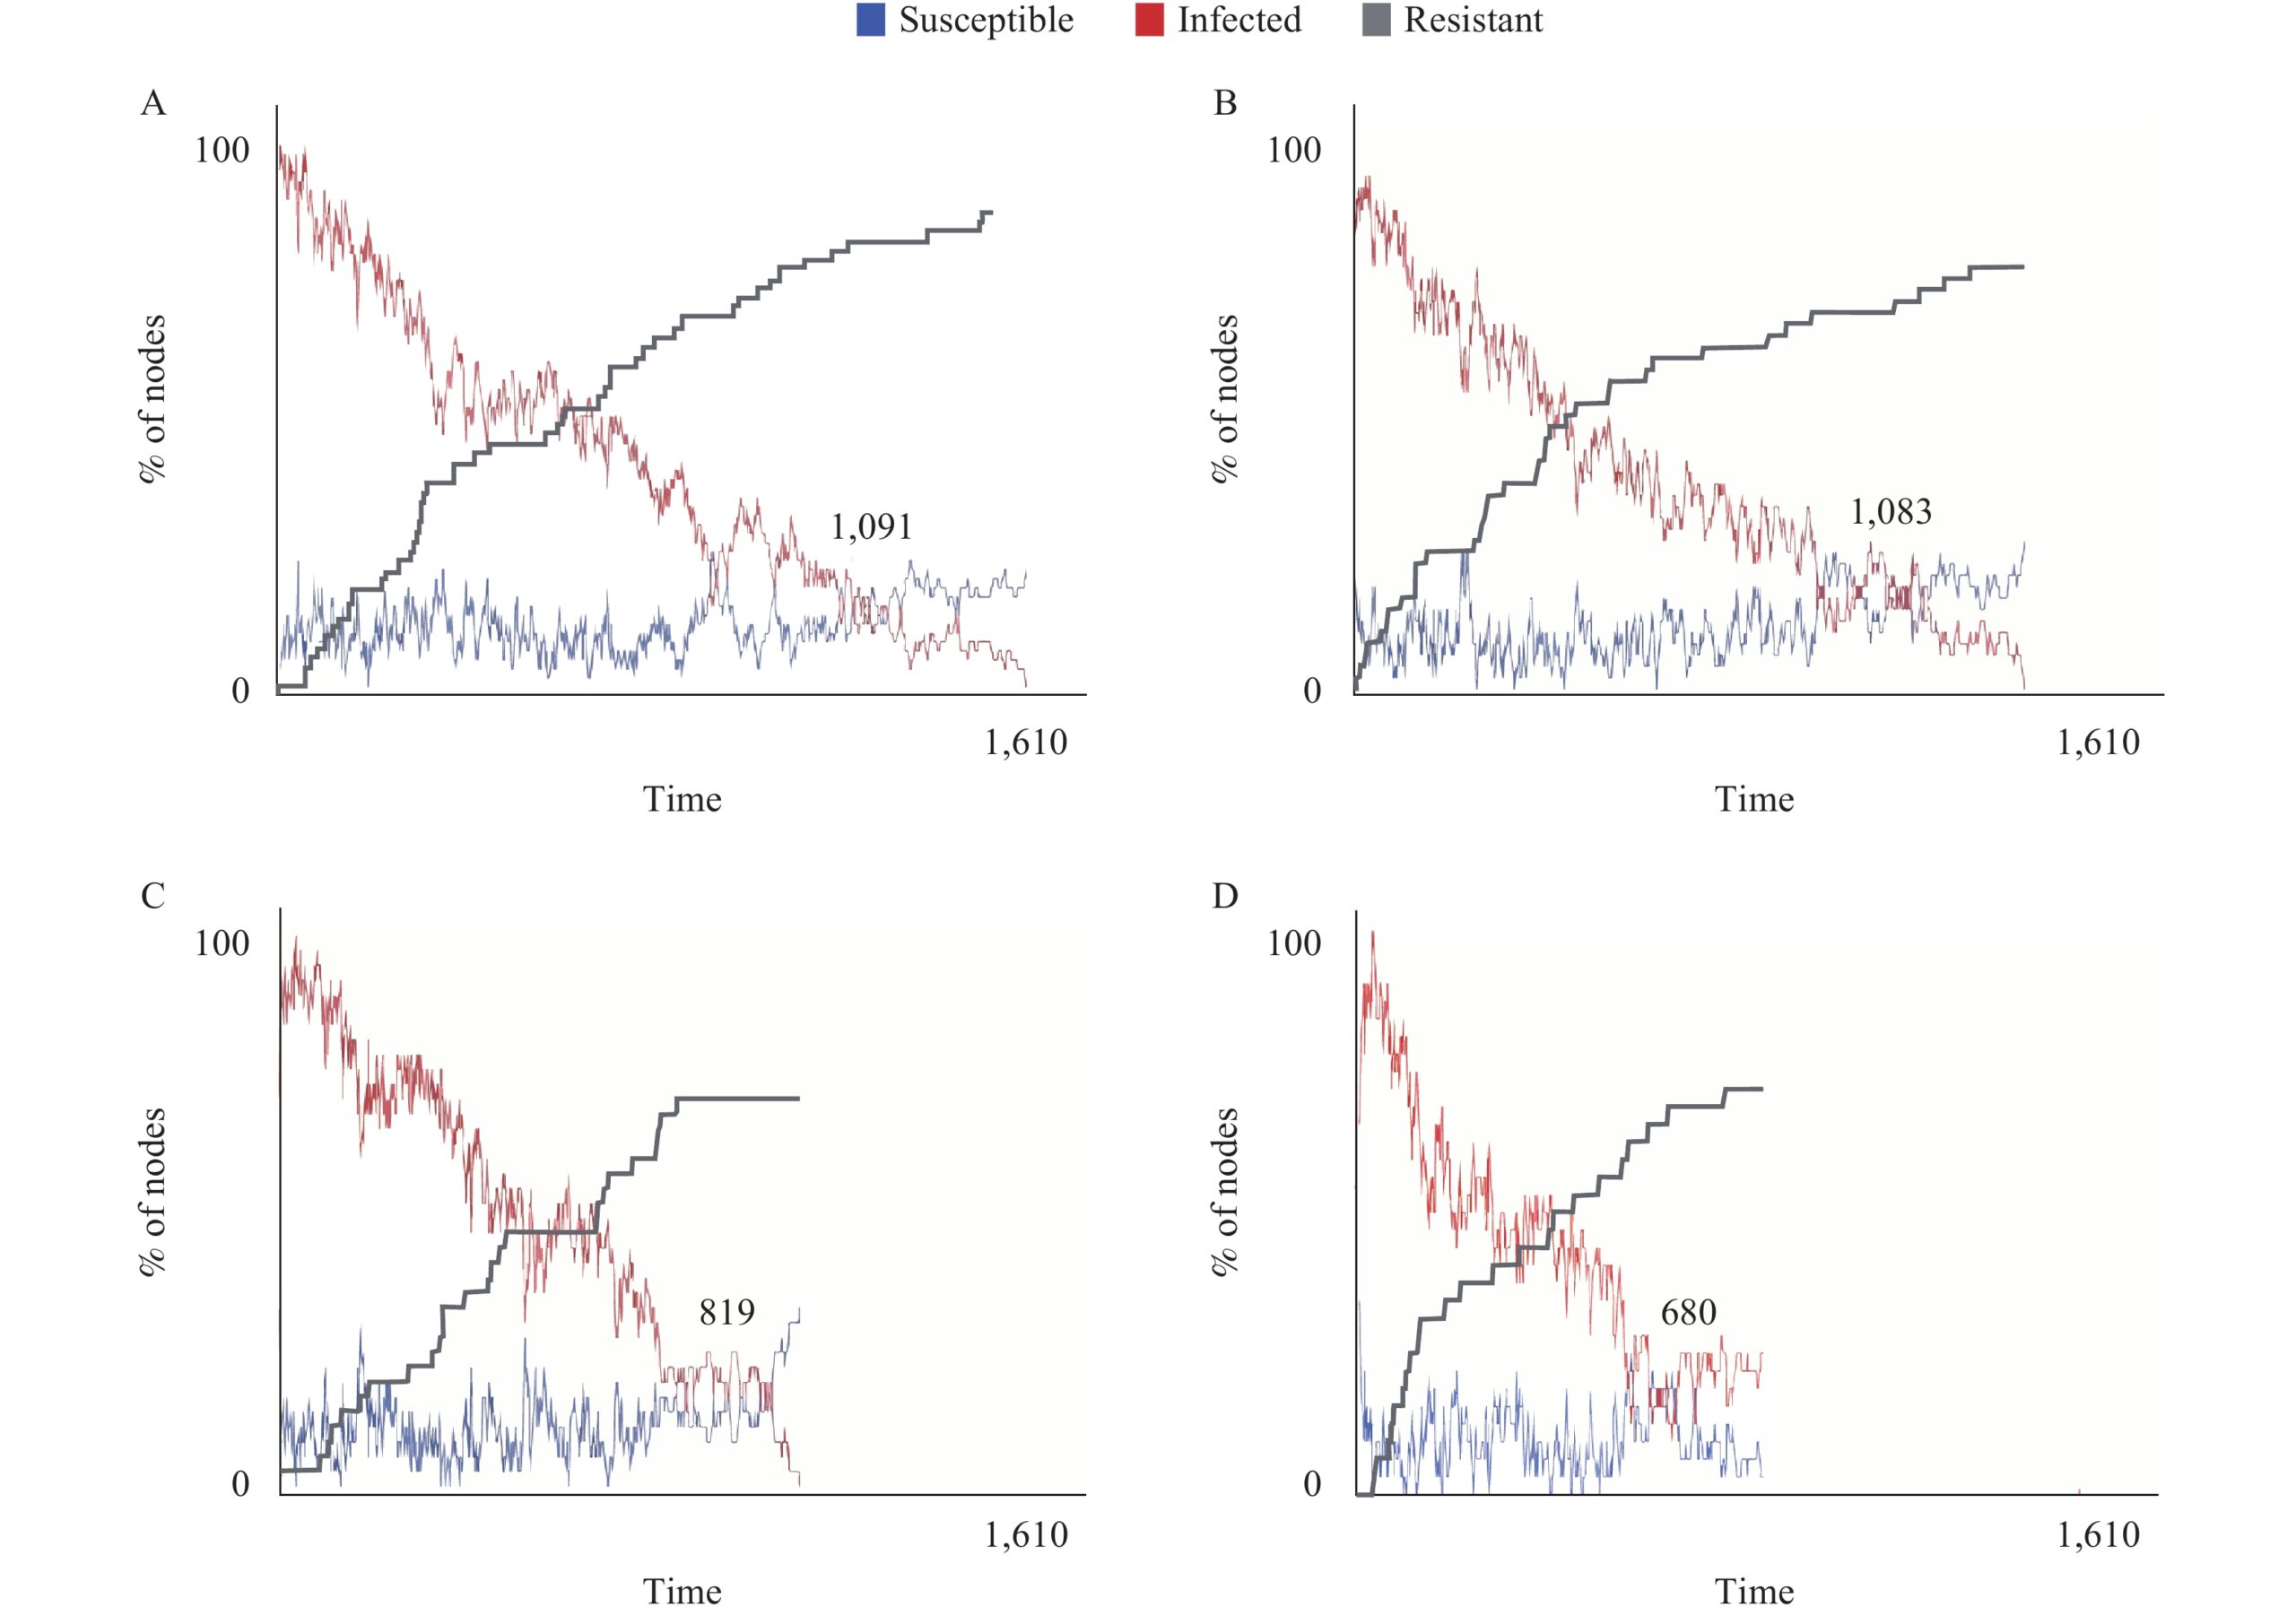
The modeling network status of different situations of a norovirus outbreak at a primary school in Zhuhai City, Guangdong Province, China, 2023. (A) Actual situation; (B) Ten random controlled nodes; (C) During the spread period, 10 key nodes (cases 2, 5, 7, 11–15, 19, and 20) were controlled; (D) Control of 10 key nodes and 2 key nodes (cases 48 and 59) in the recession period.
This post was originally published on this site be sure to check out more of their content


