


Abstract
This paper shares network data gathered through questions tailored to social network analysis and project management, specifically for construction projects. The approach addresses project complexity and performance, focusing on stakeholder network data collected retrospectively from practising project managers in the construction industry. Data collection began in 2019 and concluded in 2024. The study examines four key elements: data collection media, the appropriateness of question types, question length and wording, and the interpretation of respondents’ experiences. The resulting network data can be analysed to calculate various network measures, such as degree and eigenvector centrality. These measures can be used to visualise and understand stakeholder networks within projects and their impact on project performance.
Background & Summary
Social network structures play a vital role in shaping outcomes within projects and organisations1,2,3. Yet, there is limited empirical data that captures these structures in real-world project environments. Measuring these network structures is challenging due to many influencing factors, such as individual behaviours, attitudes, and demographics, which exist on a continuum rather than as discrete variables. Thus, designing effective data collection methods requires careful planning to ensure reliability and validity.
While surveys are commonly used to gather social network data in various fields4,5,6, few have been adapted for the context of large-scale construction or infrastructure projects. Designing data collection tools for social network data must account for multiple social network analysis measures, including fundamental concepts, developmental stages, and research gaps7,8,9,10. The dataset presented here fills this gap by offering a structured instrument tailored to the unique characteristics of project-based environments. It captures a range of network attributes along with project complexity and performance measures.
This dataset builds on established concepts in social network analysis but is grounded in the realities of project delivery. The focus is on capturing intergroup connections, stakeholder dynamics, and contextual complexity within the project lifecycle. These elements are critical to understanding performance outcomes in dynamic and distributed work settings11,12. The questionnaire used to generate this dataset was designed to support node- and network-level analysis, enabling metrics such as degree, closeness, and betweenness centralities. Responses were also structured to allow for comparison across multiple projects. Closed-ended and open-ended formats were used where appropriate to ensure data completeness and contextual clarity13. Additionally, designing questionnaires for social network analysis involves extensive consideration of data manipulation14,15.
Our focus is on intergroup network structures within large-scale projects. We propose a survey design approach that starts with mapping core concepts to determine the sequence of questions, thereby enhancing the respondent experience. The proposed questionnaire is contextualised within project settings and serves as a model for the design protocol. This study integrates research concepts from project environments, social network theory, complexity, and performance into the survey design process. By combining core aspects of project management and social network analysis, this dataset provides a foundation for future investigations into how relationships and complexity influence project performance. It enables researchers to test network-based hypotheses, benchmark relational patterns, and apply network measures in comparative studies.
Social Network Theories
The network information collected must be formatted for manipulation and analysis using social network tools and techniques. To understand the required data formats, it is essential to explore the different levels of connectivity within social networks. Fundamentally, these connections can be categorised into primary and secondary levels. Social networks can be decomposed into nodes and edges: nodes represent the actors, while edges or lines signify the ties between these actors16. The network as a whole can be viewed as a model of these relationships.
These foundational concepts are frequently employed in network analyses. This study examines node-based attributes within stakeholder networks, such as degree, closeness, and betweenness. Therefore, the data collected must reflect these social network measures. Additionally, respondents can assess the strengths and weaknesses of these ties. The following section elaborates on the criteria for ensuring the collected data meets these requirements.
Bavelas-Leavitt Theory
Alex Bavelas was a prominent researcher who studied group structures and communication patterns within social network analysis. His work has shown that various factors (e.g., job requirements, individual capabilities, social ranks, and cultural contexts) influence communication patterns’ evolution and formation. Bavelas categorised communication patterns based on symmetry, channel capacity, and unique topologies. Key concepts pioneered by Bavelas include centrality, which measures proximity to other members; distance, defined as the number of connections along the shortest path; the summation of neighbours, calculated by aggregating all positions one link away; and the outline of distances, which sums all shortest paths to connecting members17.
In the 1940s and 1950s, Bavelas and the MIT Research Group conducted experiments to explore communication patterns in group structures. One notable experiment involved college students and used symbols such as a circle, an asterisk, a triangle, a square, a diamond, and a plus sign. Each of the five subjects was given a card featuring one of these symbols, but only one symbol appeared on all five cards. The subjects were required to communicate using a written system, and the experiment was considered successful only when all subjects could effectively communicate through each symbol. The experiment was conducted 15 times, resulting in four independent groups adopting a pentagon communication pattern and another four using a linear pattern.
From these investigations, Bavelas observed that individuals tended to form communication patterns, optimising task completion efficiency. Figure 1 illustrates examples of communication patterns among five individuals18,19. Pattern A is symmetrical, circular, and lacks a clear leadership role, with each actor linked to two others. Pattern B is linear, with the total distance between any pair of actors summing to ten. Like Pattern A, Pattern B has no clear leadership, though the central actors exert greater control over information flow. Patterns C and D, though visually distinct, represent the same underlying structure: four actors are connected to a central actor who mediates and controls the flow of information, endowing this central actor with significant influence over the other four.
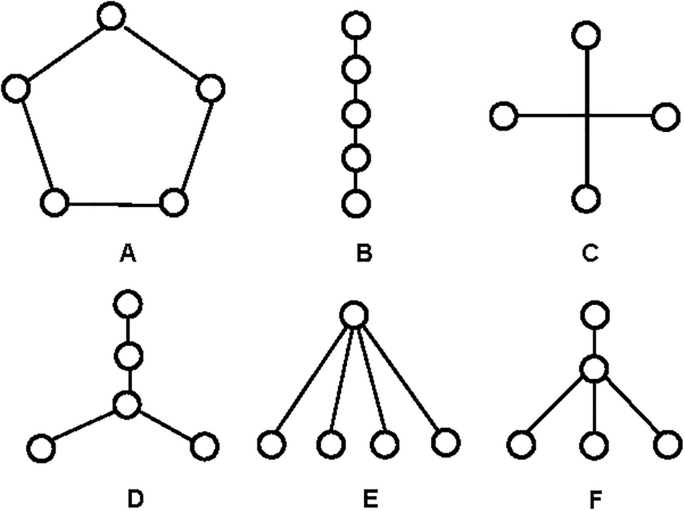
Communication patterns explored by Bavelas and Leavitt.
Leavitt later conducted similar experiments to investigate communication patterns. Five groups were examined for each communication pattern in these studies, focusing on leadership and accuracy. The results revealed some interrelationships between the attributes of the selected communication patterns20. Another experiment aimed to assess the operational efficiency of group communication networks. This experiment involved five participants, each with five playing cards from a poker deck. The participants communicated through written messages to determine the highest-ranking poker hand. The experiment was deemed complete only when one participant successfully communicated with all others regarding the chosen hand. Efficiency was measured based on the number of messages exchanged and the time required to reach a consensus.
Social network analysis encompasses various elements, including the strength of ties between actors. These factors significantly impact the overall complexity and performance of large projects. Given their influential role, these aspects are explored in greater detail in the following sections.
Granovetter’s Tie Strength Theory
The strength of ties plays a crucial role in the complexity of network systems21. This strength is influenced by time, emotional intensity, intimacy, and reciprocal service. Research has shown that network structures are also shaped by closeness, duration, frequency, interaction topics, confidence, neighbours, co-workers, kinship, prestige differences, and educational disparities22.
A key aspect of social network structures is the strength of ties, which measures the robustness of connections between participants. This concept extends Granovetter’s work by examining how factors like time, emotional intensity, intimacy, and reciprocal service impact the strength of these ties22. Understanding tie strength provides deeper insights into how these factors contribute to the overall complexity of network systems.
Network Analytics Measures (Centrality and Centralisation)
Degree centrality and centralisation
The degree centrality of a node in a network is defined by the number of connections or relationships it has with other nodes. A node with a degree of 0 is called an isolate23. Suppose every node in a graph has the same degree, denoted as ‘d’; the graph is termed d-regular or uniform. In terms of power and influence, nodes with higher degrees have greater control and a superior ability to disseminate information, even if some of their connections are disrupted. While degree centrality pertains to individual node-level metrics, degree centralisation represents a network-wide measure16. This measure reflects the overall cohesion of nodes within the network by comparing their centrality values against the network’s centralisation. For example, a degree centralisation value of ‘0’ signifies that all nodes are equally connected. Conversely, a value of ‘1’ indicates a highly centralised network, such as a star network, where a central node exhibits significantly higher centrality than others.
Closeness centrality and centralisation
Closeness centrality in a social network is determined by the distance of an actor from other actors24. This concept is intrinsically linked to geodesic distance, where actors with shorter geodesic distances to others generally exhibit more significant influence and power within the network. This is because they can reach other actors more quickly and efficiently. Closeness centralisation is a network-level measure related to closeness centrality. Like degree centralisation, it is calculated by comparing each node’s closeness centrality to the highest observed closeness centrality value within the network16. The computed value ranges between ‘0’ and ‘1’, inclusive. A value of ‘0’ indicates a fully connected network where all nodes have identical closeness centrality. Conversely, a star graph, where a single central node has the highest closeness centrality, yields a closeness centralisation value of ‘1’.
Betweenness centrality and centralisation
Betweenness centrality is a situation where an actor is positioned between two other actors in a network. This central position is significant because the actor can influence and control the flow of information between the others. For example, an actor in this role may exert power and influence by imposing “service charges” or similar mechanisms24. Like other network measures, betweenness centralisation extends the concept of betweenness centrality. This value is calculated relative to the highest betweenness centrality observed within the network, ranging from ‘0’ to ‘1’. With its highly central node, a star network results in a betweenness centralisation value of ‘1’, reflecting the most significant possible variation in betweenness centrality. Conversely, a circular network, where all nodes have identical betweenness centrality, yields a value of ‘0’.
Figure 2 illustrates the calculation of three centrality values for each node of a simple network consisting of four nodes and five edges.
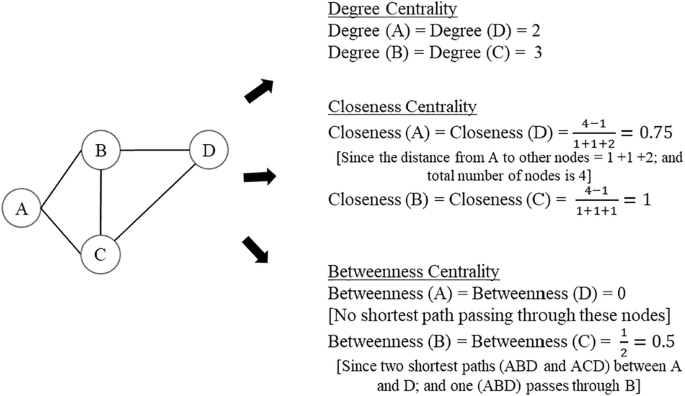
Illustration of centrality calculations using a simple network.
Complexity
Complexity is a critical factor in projects, significantly affecting their execution. To effectively address project complexity, the questionnaire must be designed to capture relevant information about it. Larger projects, in particular, face increased challenges due to their scale and numerous stakeholders’ diverse backgrounds and competing interests. Additionally, these projects often extend across geographical25,26,27,28 and technical boundaries27,29,30, which further complicates their context. Techniques for mitigating complexity often emphasise “coordination, communication, and control”29. Understanding the behavioural economics of individuals and the nature of interpersonal ties is also crucial.
Various analysis techniques have been developed to enhance the understanding of project complexity. These include both empirical and theoretical frameworks. Empirical models encompass computer content analysis, causal mappings, and organisational systems, while theoretical models involve Analytical Hierarchy Processes (AHP), Fuzzy AHP, Monte Carlo Simulations, Interpretative Structural Modeling, Systems Equations Modeling, and Fuzzy Set Theory31. Tools such as the Project Complexity Assessment and Management Tool and the Crawford-Ishikura Factor Table for Evaluating Risks (CIFTER), part of the Global Alliance for Project Performance Standards, have also been formalised32. The CIFTER method33, chosen for its accessibility and ease of use, measures complexity through 37 indicators and 23 attributes related to stakeholder management, project governance, legal and fiscal planning, interfaces, scope definition, location, design and technology, project resources, quality, and execution targets32. This extensive data collection enables the method to provide valuable and nuanced insights into project complexity.
Performance measures
Project performance is a critical indicator of project success, and the corresponding questionnaire items were designed to capture this concept’s objective and subjective dimensions. These insights were made possible through a comprehensive data collection process that, while intensive, enabled a nuanced understanding of project outcomes. Objective performance measures included quantifiable indicators such as construction time, speed, time variation, unit cost, deviations from final cost, net present value, accident rate, and environmental impact. Subjective measures encompass quality, functionality, user satisfaction, client satisfaction, design team satisfaction, and construction team satisfaction. Considering these dimensions, the questionnaire included targeted questions related to time, cost, and quality as core components for evaluating overall project performance.
Understanding the limitations of the data is crucial, particularly given the challenges in accurately measuring performance levels due to factors like the confidential nature of the data. Previous research on performance and risk often involves enlisting various indicators and having respondents rate them on a scale34,35,36. This approach has proven to be a practical design for data collection.
Methods
Questionnaire design
A structured questionnaire was developed to collect data on project networks, complexity, and performance. The instrument was organised into thematically aligned sections and included closed- and open-ended questions to capture a comprehensive set of responses from practising project managers37. The questionnaire was designed to ensure that data collected across these domains could be systematically analysed and mapped to the study’s predefined framework, as illustrated in Fig. 3.
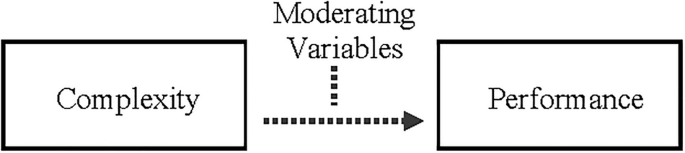
Overarching framework of the concept.
The questionnaire structure is deliberately aligned with the distinct sections of the research. It begins with external project attributes and progressively delves deeper into specific aspects. The initial sections, Instruments 1, 2, and 3, gather Respondent Contact Information, Project Background, and Socio-Demographic details, establishing a foundational understanding of the project’s contextual background. Instruments 4 and 5 focus on Professional Network Questions and Network Relationship Questions, which are integral to the Social Network Analysis component of the study. Instrument 6 addresses Project Information, specifically investigating project complexity. The final sections, Instruments 7 and 8, assess project performance from an objective standpoint and overall performance. The questions are designed to elicit comprehensive information when analysed collectively.
Written consent was obtained from participants before issuing the online questionnaire with regard to research parameters, and the collected data was de-identified to ensure respondent privacy. All collected data was de-identified by assigning respondent numbers throughout the analysis, computational and compiling processes. The recruitment process resulted in over 100 responses, cleaned and organised into four distinct categories: Group A, Group B, Group C, and Group D.
Group A comprises basic project information, including purpose, context, and monetary value. Group B centres on social networks, incorporating both node-level and network-level analyses. Node-level analyses focus on centrality measures, while network-level analyses examine centralisation metrics16,38. Group C addresses project complexity factors, including stability, importance, and impact33. Group D evaluates project performance using the iron triangle measures for each relevant factor. Table 1 provides a summary of these various groupings.
An essential aspect of the research design is applying a mixed-methods approach. By combining qualitative and quantitative data collection, this methodology facilitates a more nuanced understanding of complex relationships and allows for effective navigation of research constraints39.
Online questionnaire format
The online format for the questionnaire was chosen based on prior research that highlights the efficacy of digital questionnaires in gathering data on social network structures6,40. Considerations of dissemination efficiency and respondent convenience drove the decision to opt for an online rather than a paper-based format. The digital format facilitates broader reach and simplifies the data collection process, enhancing the overall respondent experience.
Suitability of question type
Various question formats were employed across different instruments, each selected based on the data collection type. For instruments gathering contextual information, such as Instrument 1, single-line text boxes and closed-ended questions were used to capture structured responses efficiently. In contrast, Instrument 8, which focused on project performance, included open-ended questions to allow participants to provide additional detail. All open-ended items were designed to be brief and easy to answer, ensuring accessibility for respondents5.
Multiple-choice questions were used to assess complexity, consistent with the CIFTER model33. This format was also predominantly applied to social network-related questions in Instruments 4 and 5. The design of these network-related questions drew upon pre-existing studies and recommended question inventories40, ensuring that the questionnaire was comprehensive and methodologically sound.
Length of question
The questionnaire was designed with concise and straightforward wording to support ease of completion and maintain participant engagement41. Space was provided for respondents to elaborate where more detailed input was necessary, such as in Instrument 8. In more complex sections, like Instrument 6, brief context descriptions were included alongside questions to support clarity and accurate interpretation. This approach ensured that the questionnaire remained user-friendly while capturing the required information depth. An example of one of these questions is provided below:
“Part C. Project Information
In the following section, we want to understand your project experience and background further.
The Crawford-Ishikura Factor Table for Evaluating Roles (CIFTER) (Aitken, Crawford, & Lille, 2007)
The Crawford-Ishikura Factor Table for Evaluating Roles (CIFTER) is a method employed by project managers in circumstances that have great complexity. Please circle in the following table to convey critical information about the project.
-
1)
Stability of the overall project context
-
Low (1)
-
Moderate (2)
-
High (3)
-
Very High (4)”
Respondent motivation and response experience
The questionnaire was developed for a target sample of practising project managers actively involved in project delivery. The questions were formulated to be clear and straightforward to accommodate time constraints and promote completion. Redundant items were removed to keep the questionnaire concise and focused. The questionnaire was divided into nine sections to reduce response fatigue, providing variation and enabling respondents to return later via the online platform if needed. A pilot test was conducted before full deployment to assess usability, question clarity, and the overall flow of the instrument.
Data collection process (Criteria and Context)
An online questionnaire was developed specifically to gather network data. The survey design incorporated various existing inventories and data collection techniques42,43 to ensure comprehensive coverage of the relevant aspects. The target respondents were practising project managers invited to complete the questionnaire on project performance, networks, and complexity. Participants were selected based on their extensive experience with large-scale projects and involvement in relevant stakeholder networks. The questionnaire was designed to include general and specific questions to evaluate the final performance of the projects. In addition to assessing stakeholder networks, the questionnaire also addressed performance indicators44 and complexity factors33.
The study focused on the interrelationships between stakeholder networks, project complexity, and project performance. Respondents, including those from both private and public sectors, were chosen for their relevance to the study, provided they had substantial experience with large projects and networks. Data collection targeted projects that aligned closely with the study’s objectives. The criteria for respondent recruitment are outlined in Table 2.
Protocols and policies: human ethics & research policies
The data collection process adhered to the policies and guidelines outlined in the Human Ethics Approval (Project Number: 2019/794) approved by the University of Sydney Human Ethics Research Committee. This process is prescriptive and mandates the approval and preparation of various components, including modes of contact, information sheets, questionnaire content, and additional documentation. The ethics approval outlines critical procedures for addressing potential risks or unforeseen adverse events. Each participant provided informed consent for survey participation and data sharing for research purposes.
Several techniques were employed in the questionnaire design to address these constraints. These techniques included precise word choice, formulating questions to minimise ambiguity, and including open-ended questions37. This approach is a fundamental aspect of the research protocol and questionnaire design.
In addition to adhering to general ethical standards, the research is bound by specific policies within the context of the research institute. These include the National Statement on Ethical Conduct in Human Research, the Australian Code for the Responsible Conduct of Research, and the University’s Data Management Policy. To ensure the confidentiality of all participants, the questionnaire was designed to guarantee that responses could not be linked to individual identities and were de-identified by assigning respondent numbers in place of names. We also implemented measures to anonymise stakeholder details. For example, when collecting stakeholder information, participants were asked to describe the role(s) and provide a representative name for the stakeholder(s) involved. This approach allowed us to avoid recording actual stakeholder names, often well-known within the community.
Qualitative and quantitative approaches
A mixed-methods approach was used to collect both quantitative and qualitative data relevant to the research objectives. This approach allowed for structured data collection through closed-ended questions while incorporating open-ended items to capture additional context from respondents45. Quantitative responses supported consistent measurement across participants, and qualitative input added depth where needed. The design ensured that different types of information could be collected within a single instrument. This structure enabled efficient integration of varied data formats during analysis and facilitated a more complete understanding of the dataset. The questionnaire was designed to model the proposed relationships between networks, complexity, and performance. Complexity serves as a critical tool for understanding both networks and project performance. To capture the perspectives of practising project managers effectively, the questionnaire incorporated various techniques, including open-ended questions37. These questions were included to explore concepts critical to the study’s framework.
The process of collecting project information involves a variety of methods, with questionnaires being a common choice. Effective questionnaire design is governed by several prescriptive components46 and may include a range of strategies. Questionnaires can be administered through various mediums, such as online or postal methods36,47. Hybrid approaches, combining interviews with questionnaires, are also utilised in studies focusing on critical success factors for large-scale projects48. The suitability of each method depends on the type of information being gathered.
Post-collection data manipulation is another essential consideration. For example, a study on key performance indicators for public-private partnership projects involved 48 indicators and used confirmatory factor analysis to test the proposed model35. Other studies have focused on specific aspects of project management, employing different data collection techniques, such as ranking and point scales36,49,50,51.
The questionnaire was structured to align with the research’s distinct sections. It began with general project attributes and progressively delved into more specific areas. Instruments 1, 2, and 3 gathered fundamental contextual information, including Respondent Contact Information, Project Background, and Socio-Demographic details. Instruments 4 and 5 focused on Professional Network Questions and Network Relationship Questions, exploring the Social Network Analysis component of the study. Instrument 6 assessed project complexity, while Instruments 7 and 8 evaluated project performance objectively and overall. This structured approach facilitates a comprehensive understanding of the project.
Instrument 1: respondent contact information
Instrument 1 is designed to capture fundamental contact details from the respondents. It includes fields for the respondent’s name, email address, and telephone number. This initial section aims to ensure accurate identification and communication are possible throughout the study. Additionally, contact information for the researchers is provided to facilitate any necessary follow-up or clarifications. The questions in this Instrument utilise single-line text fields and closed-ended formats to gather the required information succinctly.
Instrument 2: project background
Instrument 2 seeks to provide contextual information about the projects under study. It requests details such as the project’s purpose, name, description, country where it was executed, and classification (Private, Public, or Public-Private Partnership). Respondents are also asked to evaluate the project’s success in terms of time, cost, and scope. These responses will be compared with objective measures collected through subsequent instruments. The Instrument employs closed-ended and multiple-choice questions to systematically document the project’s context.
Instrument 3: socio-demographic survey
Instrument 3 is designed to collect socio-demographic information about the respondents, which is essential for understanding the context of the network data collected. It includes questions regarding the respondent’s industry, occupation, and years of experience. The format for these questions includes close-ended and single-line text fields, which allow for the efficient collection of relevant socio-demographic data.
Instrument 4: professional network questions
Instrument 4 focuses on mapping the professional networks pertinent to the project. It requires respondents to list key stakeholders and classify them using a drop-down list (e.g., client, contractor, supplier). The Instrument also explores the frequency and mode of communication between these stakeholders. This section employs drop-down lists and close-ended questions to gather precise information about stakeholder interactions, enabling a detailed understanding of professional networks.
Instrument 5: network relationship questions
Instrument 5 aims to delve deeper into the relationships between stakeholders, focusing on the strength and nature of these connections. It includes questions designed to measure the strength of connections on a scale from ‘Very Weak’ to ‘Very Strong’ and to assess the significance of each relationship within the network. This Instrument uses multiple-choice and single-line text formats to quantify relationship strength and facilitate in-depth network analysis. Table 3 communicates this strength quantification.
Instrument 6: project information
Instrument 6 assesses project complexity using the CIFTER model. It contains questions that evaluate various aspects of project complexity, such as stability, importance, and impact. The Instrument incorporates multiple-choice questions and contextual descriptions to support the accurate interpretation of responses related to project complexity.
Instrument 7: project outcomes
Instrument 7 evaluates project performance through objective measures. It includes questions about the project’s cost, start and finish times and scope. The format consists of close-ended questions and single-line and multiline text fields, allowing for a detailed assessment of project performance metrics.
Instrument 8: major projects summary
Instrument 8 provides a reflective summary of the project management approach and lessons learned. It includes questions designed to capture the respondent’s management strategies and insights gained from the project. This Instrument uses open-ended questions and a combination of multiple-choice and text fields to facilitate comprehensive and reflective responses.
End of survey
The final section of the survey includes contact information and allows respondents to offer additional comments or seek further clarification. This section ensures that respondents can maintain communication with the researchers as needed. Table 4 summarises the key sections.
Data collection platform
Data collection was conducted using the REDCap electronic data capture platform52 in compliance with institutional ethics protocols. A structured questionnaire was developed within REDCap and distributed electronically, enabling participant access via smartphones, tablets, laptops, and desktop computers. The platform facilitated secure, real-time data capture and incorporated basic input validation to enhance data integrity43. The survey remained active over a defined data collection period, during which responses were automatically stored in a secure, access-controlled environment for subsequent analysis. Access to the survey was managed via a unique link, and participant engagement was monitored to ensure completion rates and response consistency. Before launch, the survey instrument was pilot-tested to confirm functionality and usability across devices.
Sampling type
Existing research highlights various sampling strategies employed in data collection, particularly within social networks. Etikan and Bala53 provide a comprehensive overview of the four primary sampling techniques commonly used: simple random sampling, systematic sampling, stratified sampling, and cluster sampling. Simple random sampling involves selecting respondents without any specific criteria, ensuring that every individual in the population has an equal probability of being chosen. This approach is characterised by its lack of bias in the selection process. Systematic sampling involves arranging the target population according to a predefined scheme and selecting respondents regularly. Stratified sampling entails dividing the population into distinct subgroups or strata, from which respondents are then randomly selected. Cluster sampling involves dividing the population into clusters, randomly selecting some clusters, and then choosing respondents from within these selected clusters.
Frank54 extends these fundamental sampling strategies by exploring techniques applicable to social network data collection, such as snowball and walk sampling. Snowball sampling is beneficial for accessing hidden or hard-to-reach populations, where initial participants recruit subsequent participants, thus “snowballing” the sample size. Walk sampling, a variant of snowball sampling, involves selecting one additional participant at each stage of the sampling process, offering a structured yet simplified approach to data collection.
Hibberts et al.55 discuss extending probability sampling methods to include non-probability sampling. Non-probability sampling relies on non-random criteria for selection, which can introduce more significant bias and reduce generalisability. Despite this, non-probability sampling can be helpful in specific contexts, though the resulting survey errors are often more challenging to quantify. Monitoring potential biases is recommended to mitigate the effects of non-probability sampling.
In the current research, stratified and simple random sampling methods were utilised. Stratified sampling was employed to categorise the sample population according to predefined criteria, followed by the random selection of respondents, adhering to principles of probability sampling56. Additionally, a minor application of snowball sampling was incorporated, where existing participants assisted in recruiting new ones, facilitating access to additional units in certain instances. Figure 4 illustrates the distribution of data collected, categorised according to project performance metrics.
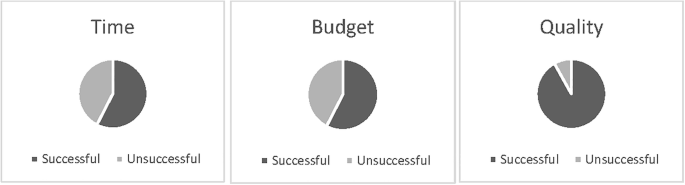
Data distribution according to the project performance metrics.
Export and post-processing
The data is initially stored in Excel for post-processing, summarised, organised into core categories, and cleaned for analysis. The core categories include basic project information (Group A), professional network information (Group B), project complexity information (Group C), and performance measures (Group D).
Subsequent processing involved computing various metrics using Gephi and Excel. Additionally, multiple metrics were determined through SPSS. Further analyses and modelling were conducted using PNet and Python to apply and refine the analytical models.
Data Records
Collected data
The dataset is available at the Harvard Dataverse repository57. The URL for the dataset is https://doi.org/10.7910/DVN/JWIANX. This dataset includes one questionnaire (Questionnaire.pdf) and two Excel files (Individual Network Data.xlsx and Other Data + Performance.xlsx) based on de-identified data. The questionnaire file details all survey questions. The first Excel file, which corresponds to the Instrument 4: Professional Network Questions section of the questionnaire, presents network information detailing node names, types and the strength of associated ties. For each respondent, this file contains one sheet for the network data. The respondent ID created during the data-deidentification process has been used to name these sheets.
Each of these sheets has five columns. Two columns are for the name and type of the first stakeholder. Similarly, another two columns are for the second stakeholder. The last column contains a quantitative value for the tie strength between these stakeholders. It also includes an Excel sheet (the first one) describing legendary tie strength details. The second Excel file provides supplementary project information, including non-network complexity factors (columns B-K, project performance metrics (columns L-O) and details of moderating factors (P-U). We have added further relevant information as comments in the column headers of this file. For example, column I is the summation of the values in columns B to H. We grouped the seven questions in columns B to H into two groups based on the factor analysis. Column J is the average of columns B and G, and column K is the average of the remaining ones (i.e., columns C to F and H).
Sample data from respondent 153
An example is provided in Fig. 5 using the data from Respondent 153 to demonstrate the analysis process of network data. Initially, the network data was transcribed and organised into an Excel spreadsheet. This spreadsheet included columns for nodes and a third column denoting the strength of the connections, or edges, between these nodes. In total, the dataset comprised 33 distinct edges connecting 10 nodes.
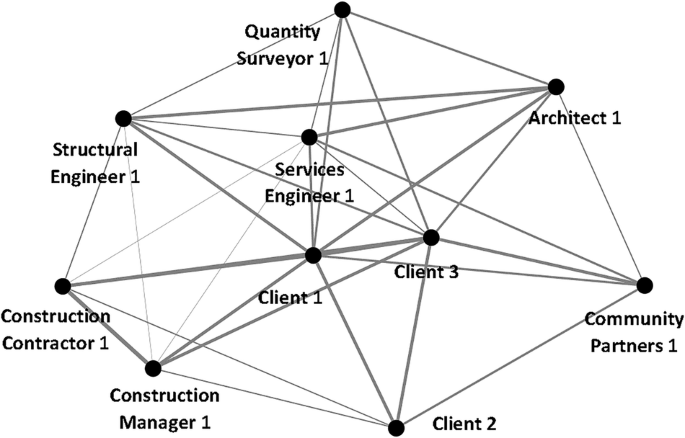
Stakeholder network of respondent 153. The link thicknesses proportionate to their tie strength value.
Following the transcription, the data was imported into Gephi, a software tool for network analysis. The edges were treated as undirected for this analysis. Key network metrics were computed, including graph density, average degree, network diameter, and the average clustering coefficient. The results of these computations were then tabulated in the data laboratory, providing a detailed output on the network’s structural properties.
For the network analysis where N = 10 and the number of edges is 33, the computed graph density was 0.733, and the average clustering coefficient was 0.806. The results obtained from Gephi were systematically tabulated and saved into distinct files for further processing and analysis of network values shown in Table 5.
Technical Validation
Questionnaire design
The questionnaire design considered various factors carefully from the literature42,43. The aim was to develop questions that would elicit reliable and valid responses while adhering to relevant policies and guidelines. The questionnaire was crafted to ensure both validity and reliability. It was designed to collect meaningful data and maintain consistency across responses to ensure reliability.
Validity can be assessed using several approaches. One approach is context-based validity, which evaluates how well the content of the questions aligns with the intended subject area. Another approach is criterion-based validity, such as predictive validity, which examines how well the questionnaire predicts outcomes based on external criteria. A third approach is construct validity, which involves techniques like factor analysis (both exploratory and confirmatory), logical comparisons, or multi-trait method matrices of correlations. This study employs context-based validity, aligning the questionnaire content and the intended research area.
Similarly, reliability can be assessed through various methods. Test-retest reliability measures consistency by comparing data collected at different times, using metrics such as Pearson’s correlation, Spearman’s rho, and Kendall’s tau. Parallel forms reliability involves comparing different versions of the questionnaire to assess consistency. Split-half reliability, evaluated using the Spearman-Brown prophecy formula, assesses consistency between two halves of the questionnaire. Finally, internal consistency reliability, often measured by Cronbach’s alpha or the Kuder-Richardson formula, evaluates how consistently the items on the questionnaire measure the same construct. This study predominantly utilises internal consistency reliability, applying Cronbach’s alpha58 to ensure the reliability of the questionnaire.
The study defined these roles based on contractual obligations for categorising stakeholder nodes. The questionnaire included a drop-down list to allow respondents to select their roles from predefined categories. Additionally, respondents had the opportunity to provide more specific descriptions of their contractual roles, ensuring a precise alignment with the study’s focus on accurately representing stakeholder responsibilities within the project framework.
We adopted several design strategies to minimise response fatigue and ensure high-quality data collection, especially among busy stakeholders such as project managers. The questionnaire was structured into concise, thematically grouped sections, allowing respondents to complete it in multiple sittings if needed. Predominantly closed-ended questions were used to reduce the time burden, with optional comment boxes for additional input. We also communicated the estimated completion time in advance. Further, we offered flexibility in completing the survey, such as participants can save the survey response and return to complete the rest later.
Factors affecting collected data quality
In acknowledging the limitations inherent in any study design, it is crucial to recognise that no approach is without its constraints. Despite efforts to minimise them, human error remains an unavoidable factor in research59. While steps can be taken to reduce the impact of such errors, their complete elimination is not feasible.
Another significant limitation is the potential for inaccuracies in identifying causal relationships. As Chrobak and Zaragoza60 noted, establishing causal links can be problematic and prone to error, necessitating careful consideration during data analysis to account for these inaccuracies.
Moreover, gaps in research questions represent a critical challenge that can influence the interpretation of collected data. Kossinets61 highlights that inadequacies in formulating research questions may lead to incomplete or skewed data interpretation. Addressing these gaps is essential to comprehensively and accurately analyse the study’s findings.
Observations and limitations
Acknowledging that every study design inherently carries potential limitations is crucial, irrespective of the methodological approach employed. Human error, as discussed by Reason59, while reducible, cannot be entirely eradicated. Also, establishing causal relationships may be prone to inaccuracies, as Chrobak and Zaragoza60 highlighted. Such inaccuracies in causal inference must be addressed throughout the data analysis process. Moreover, inadequacies or gaps in research questions can significantly impact the interpretation of the collected data, as evidenced by Kossinets61.
The study was intentionally designed to collect reliable and valid data to elucidate the underlying notions, concepts, and causal relationships relevant to the domain, especially given the increasing complexity of large-scale projects. While there is a wealth of literature on general questionnaire and survey design approaches, there remains a notable deficit of protocols tailored explicitly to project management and social network analysis. This research aims to address this gap by implementing a specialised methodology that integrates distinctive sets of instruments, survey techniques, and theoretical frameworks for design and interpretation.
A central component of the questionnaire design is the application of social network analysis, complemented by exploring project complexity to enhance understanding of project dynamics and their correlation with performance outcomes. Instruments 4 and 5, which focus on the strength of ties within networks, are particularly critical to the study, as they are instrumental in addressing the research’s central hypotheses.
Code availability
No computer codes or algorithms were utilised in this study or manuscript.
References
-
Donchenko, D., Sadovnikova, N., Parygin, D. & Shabalina, O. Promoting urban projects through social networks using analysis of users influence in social graph. Information Technologies in Science, Management, Social Sphere and Medicine, 162–165 (2016).
-
Herrera, R. F., Mourgues, C. & Alarcón, L. F. Assessment of lean practices, performance and social networks in chilean airport projects. in Proceedings of the 26th Annual Conference of the International Group for Lean Construction. (2018).
-
Castillo, T., Alarcón, L. F. & Salvatierra, J. L. Effects of last planner system practices on social networks and the performance of construction projects. Journal of Construction Engineering and Management 144(3), 04017120 (2018).
-
Brace, I. Questionnaire design: How to plan, structure and write survey material for effective market research. Kogan Page Publishers (2018).
-
Bullock, J. G. & Rader, K. Response Options and the Measurement of Political Knowledge. British Journal of Political Science, p. 1–10 (2021).
-
Stansfeld, S. & Marmot, M. Deriving a survey measure of social support: the reliability and validity of the Close Persons Questionnaire. Social science & medicine 35(8), 1027–1035 (1992).
-
Serrat, O. Social network analysis, in Knowledge solutions. Springer. p. 39–43 (2017).
-
Freeman, L. The development of social network analysis. A Study in the Sociology of Science 1(687), 159–167 (2004).
-
Yang, J., Shen, G. Q., Ho, M., Drew, D. S. & Xue, X. Stakeholder management in construction: An empirical study to address research gaps in previous studies. International journal of project management 29(7), 900–910 (2011).
-
Prell, C. Social network analysis: History, theory and methodology. Sage (2012).
-
Borgatti, S. P., Everett, M. G. & Johnson, J. C. Analyzing social networks. Sage (2018).
-
Crossley, N. et al. Social network analysis for ego-nets: Social network analysis for actor-centred networks. Sage (2015).
-
Edwards, G. Mixed-method approaches to social network analysis. (2010).
-
Walker, T. D. Estimating the Reliability of Scores from a Social Network Survey Questionnaire in Light of Actor, Alter, and Dyad Clustering Effects. Brigham Young University (2018).
-
Taktamysheva, A., Krause, M. & Smeddinck, J. Serious questionnaires in playful social network applications. in International Conference on Entertainment Computing. Springer (2011).
-
Wasserman, S. & Faust, K. Social network analysis: Methods and applications. (1994).
-
Bavelas, A. A Mathematical Model for Group Structures. Human Organization 7(3), 16–30 (1948).
-
Bavelas, A. Communication patterns in task‐oriented groups. The journal of the acoustical society of America 22(6), 725–730 (1950).
-
Leavitt, H. J. Some effects of certain communication patterns on group performance. The journal of abnormal and social psychology 46(1), 38 (1951).
-
Bavelas, A. Communication patterns in problem-solving groups. Cybernetics: Circular causal, and feedback mechanisms in biological and social systems, p. 1–44 (1952).
-
Granovetter, M. S. The Strength of Weak Ties. American Journal of Sociology 78(6), 1360–1380 (1973).
-
Marsden, P. V. & Campbell, K. E. Measuring Tie Strength. Social Forces 63(2), 482–501 (1984).
-
Wasserman, S. & Faust, K. Social network analysis: Methods and applications. Vol. 8. Cambridge university press (1994).
-
Hanneman, R. A. & Riddle, M. Introduction to social network methods. University of California Riverside (2005).
-
Plyaskina, N. & Kharitonova, V. Strategic planning of cross-sectoral resource megaprojects: Methodology and instruments. Studies on Russian Economic Development 24(2), 108–116 (2013).
-
Zhi, H. Risk management for overseas construction projects. International journal of project management 13(4), 231–237 (1995).
-
Rosa, D. & Karimov, D. Cross-cultural Project Management and Intercultural Communication Competencies in Non-profit Organizations. (2018).
-
Mok, K. Y., Shen, G. Q. & Yang, J. Stakeholder management studies in mega construction projects: A review and future directions. International journal of project management 33(2), 446–457 (2015).
-
Baccarini, D. The concept of project complexity—a review. International journal of project management 14(4), 201–204 (1996).
-
Flyvbjerg, B. & Siemiatycki, M. Cycles in Megaproject Development. (2017).
-
Qazi, A., Quigley, J., Dickson, A. & Kirytopoulos, K. Project Complexity and Risk Management (ProCRiM): Towards modelling project complexity driven risk paths in construction projects. International journal of project management 34(7), 1183–1198 (2016).
-
Dao, B., Kermanshachi, S., Shane, J., Anderson, S. & Hare, E. Identifying and measuring project complexity. Procedia Engineering 145, 476–482 (2016).
-
Aitken, A. & Crawford, L. A study of project categorisation based on project management complexity. in IRNOP VIII conference (8th annual international research network on organizing by projects). (2007).
-
Raz, T. & Michael, E. Use and benefits of tools for project risk management. International journal of project management 19(1), 9–17 (2001).
-
Yuan, J., Wang, C., Skibniewski, M. J. & Li, Q. Developing key performance indicators for public-private partnership projects: questionnaire survey and analysis. Journal of Management in Engineering 28(3), 252–264 (2012).
-
Zou, P. X., Zhang, G. & Wang, J. Understanding the key risks in construction projects in China. International journal of project management 25(6), 601–614 (2007).
-
Krosnick, J. A. Improving Question Design to Maximize Reliability and Validity, in The Palgrave Handbook of Survey Research, Vannette, D. L. & Krosnick, J. A. Editors. Springer International Publishing: Cham. p. 95–101 (2018).
-
Uddin, S. Social network analysis in Project management–A case study of analysing stakeholder networks. The Journal of Modern Project Management, 5(1) (2017).
-
Creswell, J. W. Mixed-method research: Introduction and application, in Handbook of educational policy. Elsevier. p. 455-472 (1999).
-
Daugheny, S. R. A questionnaire for the measurement of social networks and social support. From The New Editors 11(2), 20 (1988).
-
Galesic, M. & Bosnjak, M. Effects of questionnaire length on participation and indicators of response quality in a web survey. Public opinion quarterly 73(2), 349–360 (2009).
-
Stohl, C., Giles, H. & Maass, A. Social networks and intergroup communication. (2016).
-
Krosnick, J. A. Questionnaire design, in The Palgrave handbook of survey research. Springer. p. 439–455 (2018).
-
Chan, A. P. & Chan, A. P. Key performance indicators for measuring construction success. Benchmarking: an international journal. (2004)
-
Akinci, C. & Saunders, M. N. Using questionnaire surveys for within-organisation HRD research, in Handbook of research methods on human resource development. Edward Elgar Publishing (2015).
-
McLafferty, S. L. Conducting questionnaire surveys. Key methods in geography 1(2), 87–100 (2003).
-
Vehovar, V. & Manfreda, K. L. Overview: online surveys. The SAGE handbook of online research methods, 1 (2008).
-
Ogunlana, S. O. Construction professionals’ perception of critical success factors for large‐scale construction projects. Construction Innovation, (2009).
-
Akintoye, A. & Fitzgerald, E. A survey of current cost estimating practices in the UK. Construction Management & Economics 18(2), 161–172 (2000).
-
Assaf, S. A. & Al-Hejji, S. Causes of delay in large construction projects. International journal of project management 24(4), 349–357 (2006).
-
Le-Hoai, L., Lee, Y. D. & Lee, J. Y. Delay and cost overruns in Vietnam large construction projects: A comparison with other selected countries. KSCE journal of civil engineering 12, 367–377 (2008).
-
Harris, P. A. et al. Research electronic data capture (REDCap)—a metadata-driven methodology and workflow process for providing translational research informatics support. Journal of biomedical informatics 42(2), 377–381 (2009).
-
Etikan, I. & Bala, K. Sampling and sampling methods. Biometrics & Biostatistics International Journal 5(6), 00149 (2017).
-
Frank, O. Survey sampling in networks. The Sage handbook of social network analysis, p. 389–403 (2011).
-
Hibberts, M., Burke Johnson, R. & Hudson, K. Common survey sampling techniques. Handbook of survey methodology for the social sciences, p. 53–74 (2012).
-
Delice, A. The Sampling Issues in Quantitative Research. Educational Sciences: Theory and Practice 10(4), 2001–2018 (2010).
-
Ong, S. & Uddin, S. Stakeholder Networks and Project Performance. Available from: https://doi.org/10.7910/DVN/JWIANX (2024)
-
Cronbach, L. J. Coefficient alpha and the internal structure of tests. psychometrika 16(3), 297–334 (1951).
-
Reason, J. Human error. Cambridge university press (1990).
-
Chrobak, Q. M. & Zaragoza, M. S. When forced fabrications become truth: Causal explanations and false memory development. Journal of Experimental Psychology: General 142(3), 827 (2013).
-
Kossinets, G. Effects of missing data in social networks. Social networks 28(3), 247–268 (2006).
Acknowledgements
This research received no specific grant from funding agencies in the public, commercial, or not-for-profit sectors.
Author information
Authors and Affiliations
Contributions
Stephen Ong: Data Analysis, Data curation, and Writing (original draft, review, and editing). Shahadat Uddin: Conceptualisation, Supervision, Data curation, and Writing (original draft, review, and editing).
Corresponding author
Ethics declarations
Competing interests
The authors declare no competing interests.
Additional information
Publisher’s note Springer Nature remains neutral with regard to jurisdictional claims in published maps and institutional affiliations.
Rights and permissions
Open Access This article is licensed under a Creative Commons Attribution-NonCommercial-NoDerivatives 4.0 International License, which permits any non-commercial use, sharing, distribution and reproduction in any medium or format, as long as you give appropriate credit to the original author(s) and the source, provide a link to the Creative Commons licence, and indicate if you modified the licensed material. You do not have permission under this licence to share adapted material derived from this article or parts of it. The images or other third party material in this article are included in the article’s Creative Commons licence, unless indicated otherwise in a credit line to the material. If material is not included in the article’s Creative Commons licence and your intended use is not permitted by statutory regulation or exceeds the permitted use, you will need to obtain permission directly from the copyright holder. To view a copy of this licence, visit http://creativecommons.org/licenses/by-nc-nd/4.0/.
About this article

Cite this article
Ong, S., Uddin, S. A Dataset of Stakeholder Networks for Project Performance Analysis.
Sci Data 12, 796 (2025). https://doi.org/10.1038/s41597-025-05165-8
-
Received:
-
Accepted:
-
Published:
-
DOI: https://doi.org/10.1038/s41597-025-05165-8
This post was originally published on this site be sure to check out more of their content