


Abstract
The fast development of social media platforms has led to an unprecedented growth of daily short text content. Removing valued patterns and insights from this vast amount of textual data requires advanced methods to provide information while preserving its essential components successfully. A text summarization system takes more than one document as input and tries to give a fluent and concise summary of the most significant information in the input. Recent solutions for condensing and reading text are ineffective and time-consuming, provided plenty of information is available online. Concerning this challenge, automated text summarization methods have developed as a convincing choice, achieving important significance in their growth. It was separated into two kinds according to the abstraction methods utilized: abstractive summarization (AS) and extractive summarization (ES). Furthermore, automatic text summarization has many applications and spheres of impact. This manuscript proposes an Adaptive Search Mechanism Based Hierarchical Learning Networks for Social Media Data Summarization and Classification Model (ASMHLN-SMDSCM) technique. The ASMHLN-SMDSCM approach aims to present a novel approach for text summarization on social media using advanced deep learning models. To accomplish that, the proposed ASMHLN-SMDSCM model performs text pre-processing, which contains dissimilar levels employed to handle unprocessed data. The BERT model is used for the feature extraction process. Furthermore, the moth search algorithm (MSA)-based hyperparameter selection process is performed to optimize the feature extraction results of the BERT model. Finally, the classification uses the TabNet and convolutional neural network (TabNet + CNN) model. The efficiency of the ASMHLN-SMDSCM method is validated by comprehensive studies using the FIFA and FARMER datasets. The experimental validation of the ASMHLN-SMDSCM method illustrated a superior accuracy value of 98.87% and 98.55% over recent techniques.
Introduction
With the growth of Internet-based applications, social networks like community question-answering, microblogs, and web forums give a platform of knowledge to allow individuals to share, create, or exchange interests, data, and points of view1. Utilizing media platforms, individuals can be linked anytime and anywhere, providing online channels to permit individuals to communicate with one another. Social media is changing the world due to its interactivity and timeliness, and it gives a perfect chance to inspect human behaviour through a novel lens2. Recently, the communication landscape has experienced an intense alteration with the dominance of social networking stages like Facebook, Twitter, and many more. These digital media have quickly become primary channels for real-world dissemination of updates and news, creating unprecedented synergies among immediacy and data3. With improved learning on the internet and digital media, textual data is produced in huge quantities; consequently, automated short-text summarization has become more significant. A textual summarization method requires one or more documents as input and endeavours to yield a fluent and concise outline of the most critical data in the input4. Multiple summarization methods have recently been projected to absorb text streams, news articles, microblogs, opinionated documents, and community question-answering. Textual summarization techniques might be segmented into dual segments: AS and ES. AS comprises upcoming new sentences that generalize data and are used to comprehend this data; dissimilar ES includes picking related words or lines from the resource material5. Prior examination in textual summarization was aimed at the single document summarization challenge, where the input was only a single document. With the development of research, massive irrelevance of the web-motivated investigation on multi-document summarization where the overview is created from diverse similarities but various documents. Brief textual summaries created by an automated process are required in multiple spheres of present human actions, comprising business, healthcare, education, and social media. These summaries assist in effectually extracting key insights, enabling quicker decision-making, and enhancing overall productivity in diverse domains6.
They assist the writers, particularly journalists, to enhance news headlines or brief statements explaining extended parts so that the readers can endure upgradation with time and minimum effort. Comparator summarization technologies help consumers quickly review large volumes of reports, emails, and meeting minutes, enabling them to make better decisions, particularly in the corporate environment7. Moreover, while the message is short on media platforms, summarization models make it easier to advance short-term posts from summaries depending on a massive part of the content, guaranteeing that substantial data reaches the audiences. Social networking sites are the primary cause behind the much more intensive pushes to form automated shorttextual summary approaches8. Therefore, it is probable to elucidate these brief sentences, observe and control media platform data, and promptly give reactions or presumptions. The rapid expansion of online platforms has significantly transformed how people interact, share data, and engage with content. Social media now plays a significant role in shaping communication, giving an easily accessible space for individuals to exchange ideas, opinions, and information in real-time9. This has resulted in a massive increase in the volume of textual data generated across platforms. Efficiently summarizing and classifying this data is crucial for organizations and users to extract meaningful insights and make informed decisions. The capability to process and analyze such large-scale text data has become essential, driving the requirement for advanced techniques like adaptive search mechanisms and DL methods for improved text summarization and classification10.
This manuscript proposes an Adaptive Search Mechanism Based Hierarchical Learning Networks for Social Media Data Summarization and Classification Model (ASMHLN-SMDSCM) technique. The ASMHLN-SMDSCM approach aims to present a novel approach for text summarization on social media using advanced DL models. To accomplish that, the proposed ASMHLN-SMDSCM model performs text pre-processing, which contains dissimilar levels employed to handle unprocessed data. The BERT model is used for the feature extraction process. Furthermore, the moth search algorithm (MSA)-based hyperparameter selection process is performed to optimize the feature extraction results of the BERT model. Finally, the classification uses the TabNet and convolutional neural network (TabNet + CNN) model. The efficiency of the ASMHLN-SMDSCM method is validated by comprehensive studies using the FIFA and FARMER datasets. The key contribution of the ASMHLN-SMDSCM method is listed below.
-
The ASMHLN-SMDSCM model initiates by performing thorough text pre-processing to remove noise and irrelevant data from raw text data. This step ensures that only clean, meaningful input is sent to the model for further processing. By optimizing the quality of the input data, the model improves the overall performance of subsequent feature extraction and classification tasks.
-
The ASMHLN-SMDSCM technique utilizes BERT to extract contextualized features from text and capture complex language variances and relationships. This process significantly enhances the model’s understanding of intrinsic linguistic patterns and semantics. By integrating BERT-based feature extraction, the model improves its capability for handling varied and dynamic social media content.
-
The ASMHLN-SMDSCM methodology employs the MSA to optimize hyperparameters, ensuring the optimal configuration for enhanced performance. This adaptive technique fine-tunes model parameters, improving accuracy and efficiency. By using MSA, the model effectually balances precision and computational efficiency for improved outputs.
-
The ASMHLN-SMDSCM method incorporates TabNet with CNN to classify social media text data robustly. This hybrid approach employs TabNet’s efficient decision-making capabilities alongside the strength of the CNN model in capturing spatial features. Together, they improve the technique’s capability to classify complex, high-dimensional text data precisely.
-
The ASMHLN-SMDSCM approach uniquely integrates BERT for advanced feature extraction with the MSA model for precise hyperparameter optimization, creating a more robust model. Integrating BERT’s contextual understanding with MSA’s adaptive search results in superior complex text data processing performance. Moreover, the hybrid use of TabNet and CNN for classification provides a novel, efficient, and adaptable solution for social media text summarization and classification tasks. This synergy sets the model apart in effectively handling dynamic and varied data sources.
Related works
Joshi et al.11 projected DeepSumm, an innovative approach that depends on word embeddings and topic modelling for removing the summarization of single documents. Modern summarization approaches rely upon the sequence of systems that failed to take the longer variety of semantical papers summarized in the subject document vectors. In DeepSumm, a significant goal is to employ the latent data in the document evaluated through vector topics and system sequences to enhance the summarised text’s accuracy and quality. The encrypted and decrypted outputs are the sequence-wise systems integrated after weighting to utilize an attention mechanism and changed into a score over the multi-layered perceptron system. Ghanem et al.12 developed a new method for automated text summarization focused on enhancing precision while reducing redundancies. Yin et al.13 developed an innovative method for disaster text classification by improving a pre-trained Large Language Model (LLM) over guidance fine-tuning for the intended multi-label categorization of disaster-related tweets. This model generates an extensive guidance database from disaster-related tweets that adjusts an open-source LLM, thus embedding it with knowledge of specific disasters. This fine-tuned technique categorizes several features of disaster-related data concurrently, such as the kind of event, intervention of human aid, informativeness, and substantially enhancing the usage of social networking data for circumstantial awareness in disasters. Anoop et al.14 employ a graph neural network-integrated with ML models to categorize ChatGPT consumer sentiments. It gathered 8202 tweets and physically labelled them into negative, neutral, and positive groups. It creates the explainable model utilizing SHAP (SHapley Additive exPlanations), a game theoretical model for elucidating the result of some ML techniques. Li et al.15 developed a novel social media rumour harm metric based on rumour knowledge propagation and an RSK-T5 and LLM. This approach initially concluded the joint task of rumour comment recognition and sentiment analysis (SA) to take vital aspects of rumour propagation. Subsequently, this information is employed in the pre-trained LLM method to enhance the method knowledge of rumour propagation designs.
Gong et al.16 developed an extensive structure adapted to categorize effectively and mine public opinion on URT services from media platforms. Employing information from 10 Chinese Cities with a wide-ranging URT system, a specific-domain lexicon is semi-automatically made by incorporating official documents and higher-frequency online terms. In addition, a textual classification model, depending on this lexicon, is projected. Paul et al.17 handle the problem by projecting an innovative hybrid model called Hybrid Video Summarization (HyV-Summ) that incorporates non- and DL models to employ their strengths by aiming only at social networking content. This technique advanced a traditional database, SocialSum, to train this presented method, HyVSumm, since current benchmark databases such as SumMe and TVSum include multiple kinds of content indefinite to social media videos. In18, investigate the amalgamation of automatic pre-processing and textual summarization, utilizing NLP models to increase text quality, reduce sound, and improve the rehabilitation of crucial insights. This symbiotic incorporation of pre-processing and summarization intends to streamline the particulars of textual comprehension, thus expediting data summarization, comprising real-world SA. This work utilizes evaluation metrics to compare and compute outcomes, offering visions into the effect of pre-processing on the short text summarization. Notably, the emphasized outcomes raise the efficiency of textual summarization, while the pre-processing model stimulates it. Indian et al.19 propose RoBERTa for SA and Naive Bayes (NB) for sarcasm detection. RoBERTa outperforms VADER due to its Transfer Learning, deep contextual understanding, and pretraining. Capatina et al.20 identify and interpret knowledge maps in social media research, concentrating on the impact of DL and neural networks in content analysis and highlighting the role of large-scale group decision-making (LSGDM) in addressing research challenges. Meena, Mohbey, and Indian21 classify reviews from different ethnic groups using real-time social media data, classifying sentiments as positive, negative, or neutral. CNN models are utilized and compared with other ML methods.
AbdelAziz et al.22 present an unsupervised extractive ATS methodology that enhances biomedical document summaries by improving subtopic diversity using topic modelling, clustering, and BERT. Kumar, Mahrishi, and Meena23 introduce a comprehensive review of automatic speech recognition (ASR) systems, emphasizing recent developments and innovative approaches in speech recognition technology. Khan et al.24 propose an attention-based, stacked two-layer CNN-Bi-LSTM DNN to enhance performance. The model extracts features utilizing Bi-LSTM in both forward and backward directions, with the output sent to an attention layer for assigning varying values to words. A second Bi-LSTM layer is added to improve the network’s performance. Cui and Shang25 propose a multimodal interaction and graph contrastive learning network (MIGCL) for fake news detection. It comprises cross-modal alignment and filtering mechanisms and a hierarchical graph contrastive learning framework that explores intra- and intermodal representations through unimodal and multimodal graphs. Vinitha and Vasundra26 introduce an ML model integrating Diverse Beam Search-Based Maximum Mutual Information (DBSMMI) and Ant Colony Optimization (ACO)-optimized DBNTS for text summarization and clustering of COVID-19 Twitter data. The model also utilizes k-means for semantic clustering and ACO for optimization while implementing a semantic recommender system for relevant news suggestions. Arjaria et al.27 developed an accurate rumour detection system for social media by employing user history, tweet propagation patterns, and semantic relations, adding an attention mechanism for improved accuracy. Rautaray, Panigrahi, and Nayak28 present an enhanced Particle Swarm Optimization with Backtracking Search Optimization (PSOBSA) approach for feature extraction and recommends utilizing a 2D CNN with an attention-based ABS-BiLSTM model for classification and generating summarized sentences.
While various studies have contributed to text summarization, SA, and fake news detection, several limitations and research gaps still exist. Many existing models depend heavily on a single modality or feature set, often failing to exploit multimodal interactions or contextual relationships across data fully. Furthermore, specific models lack interpretability, making it difficult to comprehend how decisions are made. More advanced techniques are required to handle large-scale, diverse, dynamic datasets, such as real-time social media content. Moreover, the accuracy of rumour detection systems can still be enhanced by considering additional context, user behaviour, and evolving patterns in data propagation. Lastly, many techniques are not optimized for real-time applications or large datasets, limiting their scalability and efficiency.
The proposed methodology
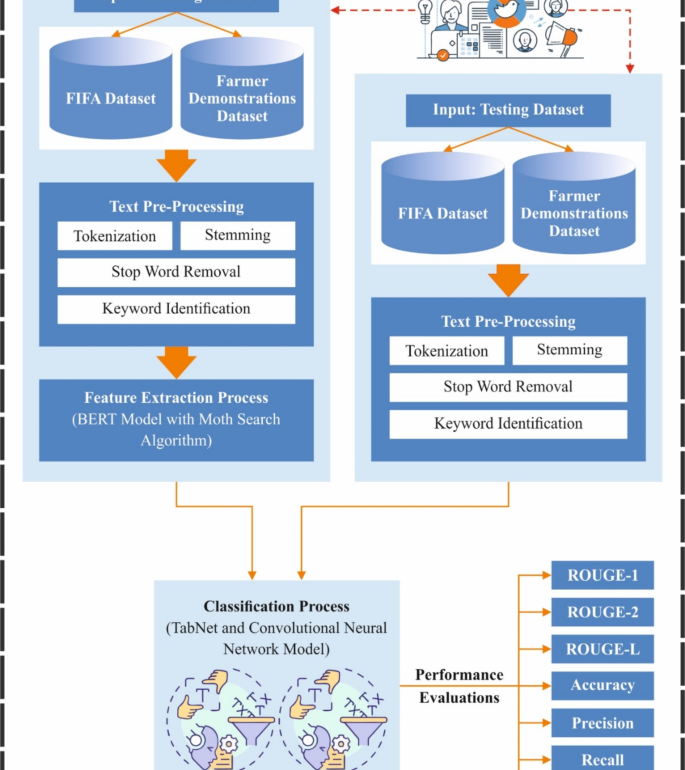
This manuscript proposes a new ASMHLN-SMDSCM technique. The proposed ASMHLN-SMDSCM model aims to present a novel approach for text summarization on social media using advanced DL models. It comprises distinct levels of text pre-processing, feature extraction, optimization process, and data summarization model. Figure 1 demonstrates the entire procedure of the ASMHLN-SMDSCM technique.

Overall process of ASMHLN-SMDSCM technique.
Text pre-processing
At the primary stage, the proposed ASMHLN-SMDSCM model applies text pre-processing, which contains dissimilar levels deployed to handle unprocessed data. Tokenization, Stop word removal, keyword recognition, and stemming are all used to normalize terminology. Improving the accuracy and efficacy of summarization methods requires removing redundancy data, handling absence values, and ensuring uniform presentation.
Text pre-processing is an essential stage within the NLP method. The following establishes its significance.
-
Stop word removal: This phase eliminates often utilized words that lack semantic content, containing these and then removing them from text-based material.
-
Stemming: It removes prefixes and suffixes from words to retrieve them to their base format. Word presentation is diminished to its principal type.
-
Tokenization: Sentence segmentation splits text into necessary modules recognized as tokens, such as phrases, words, and characters.
-
Keyword identification: The model recognizes phrases or words that are significant for the setting or topic of the text. Keywords are essential for understanding the main content and for another action, namely categorizing, summing, and indexing.
BERT feature extraction
The BERT model is utilized for the feature extraction process29. This model was chosen because it can capture deep contextual relationships within the text by processing them bi-directionally. Unlike conventional models that read text sequentially, BERT considers both a word’s left and right context, giving a more comprehensive comprehension of language. This capacity significantly improves the model’s performance in SA, classification, and summarization tasks. BERT has been shown to outperform other techniques, such as Word2Vec and GloVe, in understanding complex semantics and word dependencies. Pre-trained BERT models can also be fine-tuned for specific tasks, allowing faster training and better generalization. Its robustness across various natural language processing tasks makes it an ideal choice over other methods lacking such depth in contextual understanding. Figure 2 illustrates the structure of the BERT model.

BERT architecture.
Computers can only understand mechanical language; the words should be converted into word vectors or numerical representations, then recorded as data matrices to recognize the textual language. The model’s performance shows limits among the well-known context-based word embedding methods, like FastText, Glove, and Word2Vec. It uses bi‐directional Transformer encoding as feature extractors, while the single encoder processes standard sequences and the other processes inverse sequences. Through this bi‐directional language model training, BERT understands the contextual information of the language more intensely and has excellent semantic diversity. Compared with uni-directional encoders, which can solely rely on sequence information to remove semantics, it has a predominant capability to remove semantic information, decreasing the likelihood of making mistakes before making predictions.
Even though the statement lengths in the dataset are different, it is required by inputs to BERT to preserve uniform length. Since barrage comments normally create small texts, the statement length of 200 characters is normalized. For all the cases where the statement surpasses 200 characters, the first 200 characters are maintained; when the length falls apart from 200 characters, padding with (:left[0right]) is used. This paper uses the BERT method, particularly the BERT- base‐Chinese form designed for the Chinese language. The method includes 12 layers of encoder networks, with every layer’s hidden state dimension fixed to 768, producing 768‐dimension feature vectors, and is furnished with 12 attention heads. These vectors not only seize local written information, but additionally incorporate context moves from the complete text, thus providing a richer semantical basis. It initially carried out word embedding models on the barrage text by a length of 200 characters, comprising positional, sentence, and word embedding. Afterwards, processing tokenization, the different tokens “[SEP]” and “[CLS]” are introduced at the start and end of the sequence, correspondingly converting the sentence into a numerical matrix (:{E}_{n}) with sizes of (202,768), applied for the following classification tasks and sentence pair separations. The method is trained using a collection of Next Sentence Prediction (NSP), Masked Language Model (MLM) approaches and loss functions to improve training performance. (:left{{E}_{1},:{E}_{2},:{E}_{3}dots:{E}_{n}right}) signifies the input vectors of the model. Formerly, over 12 layers of Transformer Encoding architectures, all words are converted into output vectors (:{T}_{n}) comprising richer semantic and syntactic features, represented as (:left{{T}_{1},:{T}_{2},:{T}_{3}dots:{T}_{n}right}), acting as inputs to downstream Bi-LSTM methods.
The Transformer method depends mainly on the self-attention mechanism that fine-tunes the degree of association amongst words to take their essential features. In self-attention calculation, all feature vectors (:{A}_{i}) experience 3 different linear layers, represented as (:{A}_{Q},{:A}_{K}), and (:{A}_{V},:)giving 3 dissimilar vectors called value V, query (:Q), and key (:K), with dimensions (:{d}_{Q},{d}_{K},{d}_{V}) correspondingly. The scaled dot‐product attention mechanism calculates the dot product amongst (:Q:)and(::K) scales for every key by (:sqrt{d}k) and uses a softmax function to get attention score weights. The expression is as shown:
Setting attention scores to 0 will provide ineffectual calculation and gradient propagation in training. Therefore, attention scores are fixed to a smaller value than 0. Separating by (:sqrt{d}k) guarantees steady gradient calculation and propagation. It uses multi-head attention that mutually takes care of information from dissimilar representation subspaces at various locations.
MSA-based optimization process
Afterwards, the MSA-based hyperparameter selection process is performed to optimize the feature extraction results of the BERT model30. This method is chosen due to its effectual global search capabilities, which assist in detecting the optimal set of parameters for the BERT model. Unlike conventional grid or random search methods, MSA replicates the natural foraging behaviour of moths, allowing it to explore a broader range of potential solutions and avoid local minima. This adaptive search process improves the capability of the BERT method for extracting high-quality features by fine-tuning parameters such as learning rates and batch sizes. Furthermore, MSA needs fewer iterations to converge than other optimization techniques like genetic algorithms (GAs) or particle swarm optimization (PSO), making it computationally effective. By improving the feature extraction process, MSA directly improves the technique’s overall performance in complex tasks. Its ability to balance exploration and exploitation gives a significant advantage over other hyperparameter tuning methods. Figure 3 demonstrates the MSA framework.

MSA framework.
Recently, a novel optimizer model has been developed to stimulate the moth’s behaviour, containing Phototaxis and Lévy flights (LF). This model is named MSA. One significant characteristic of the moths is Phototaxis behaviour. According to this feature, moths tend to transfer into the sources of light. Numerous hypotheses were offered to explain this phenomenon. According to an additional significant hypothesis, the angle concerning the light and the moth source changes continuously; however, frequently, it is derived from observations owing to the longer distances. Moreover, the angle variations should be clear when most individuals choose a local light source to navigate. The moths remain fly until they attain the optimum direction to the light sources.
Another attractive characteristic of the moths is their LF, owing to their arbitrary flies, demonstrated by the heavy-tailed statistic, Non-Gaussian. This method describes the kind of arbitrary walking with Lévy distribution stages. On the assumption of a shorter distance between the moths and the top individual, they would fly in the field through the motion of LF. The succeeding equation describes this method:
Whereas (:i) defines the moth number, (:t) defines the present iteration, (:{x}_{i}^{t+1}) and (:{x}_{i}^{t}) represent upgraded and the novel locations for iteration (:t); correspondingly, (:Lleft(sright)) denotes LF stand down, and (:beta:) represents the scale feature attained by the succeeding equation:
Whereas (:{S}_{max}) defines the(::text{m}text{a}text{x}) walking stage.
The LF is attained by the succeeding Eq. (4):
Here, (:s) refers to a positive value, (:varGamma:left(iright)) describes the gamma function, and (:alpha:) stands for constant equivalent to 1.5.
Occasionally, moth individuals with greater distances from the source fly to the sources of light are modelled as shown:
Here, (:{chi:}_{best}^{t}) describes the optimal moth individual of the present iteration ((:t)), (:rho:) defines the speeding-up feature, and (:gamma:) denotes the scale aspect.
Adding to this is a dissimilar motion for the moths as they move to a location away from the sources of light, which is expressed by the next Eq. (6):
Now, (:gamma:) refers to randomly generated numbers that signify the scale factor for developing the population diversity and for controlling the model speed of convergence, (:{x}_{i},{x}_{best}), and (:{x}_{i,:new}) describe the updated, the unique, and the best positions for moth number (:i,) correspondingly.
The ROUGE metric is extensively applied to assess text summarization by matching the overlap between the reference summary and generated summaries. It calculates F1-score recall, precision, and according to n-grams, longest common subsequence (LCS), or skip-grams. The fitness function for ROUGE optimization, in summary, is stated as follows:
Here α,β,γ means weighting for F1-score ((:ROUG{E}_{F1})), precision ((:ROUG{E}_{P})), and recall ((:ROUG{E}_{R})), correspondingly.
Data summarization model
Finally, the classification process is performed using the TabNet + CNN model31. This method is chosen because it can effectively handle tabular and spatial data, making it appropriate for social media text classification tasks. TabNet’s unique attention mechanism enables it to concentrate on the most crucial features while preserving interpretability, allowing for better decision-making. By integrating TabNet with CNN, the model benefits from the strength of CNN in capturing hierarchical patterns and local dependencies in data, which is critical for text classification tasks. This hybrid approach ensures robust performance in handling large, high-dimensional datasets, which conventional models, namely decision trees or logistic regression, may face difficulty with. Unlike simpler models, the TabNet + CNN combination balances computational efficiency with high accuracy. Moreover, TabNet’s DL capabilities allow it to adaptively learn feature importance, which improves classification performance without requiring extensive feature engineering. Figure 4 depicts the structure of TabNet.

Structure of TabNet technique.
TabNet is a DL method that functions over sequential multi-level processing. Applying this specific deep structure develops the model to feature selection (FS) and increases the capability to get and understand higher-dimension characteristics. In all iterations at the (:{n}^{th}) stage, feature vectors through (:D)‐dimensions are handled, and the resultant output is focused on the block recognized as the Feature Transformer Block (FTB). FTB contains numerous layers, which may be broadcast through decision phases or particular to specific decision phases. All blocks have gated linear unit (GLU) activation, a batch normalization layer, and fully connected (FC) layers. In addition, the GLU is related to a standardization residual connection that plays a part in steadying the change in the system. The execution of this multi-layer block allows the FS procedure to be executed and enhances the system’s parameter function.
The presented model includes numerous components, notably a mask, feature transformer, attentive transformer (AT), ReLu activation, and split node, which exist in all iterations. The phases are ordered sequentially, gradually improving till the attainment of (:N) stages; at that point, they are associated with an FC layer to give the output. The AT method incorporates different modules: batch normalization, FC layer, previous scale, and sparse-max, reducing the dimensions. The masking function provides significant feature advancements in aggregation. If (:{M}_{bj}left[iright]=0), there are no feature influences. The Feature Transformer is associated with the Mask and AT, allowing real FS at all iterations. The AT is a computing component consisting of numerous layers, including batch normalization and FC layers. The performance of the AT expression and its consistent masking process is established in Eq. 2.
In this context, (:a[i-l]) characterizes the previous phase, (:Pleft[iright]) signifies the last scale, and (:{h}_{i}) mentions a trainable function. The AT combines dual essential elements, like the activation function of the sparsemax and the previous. The feature vectors dimension is limited to using sparsemax, which presents sparsities. Then, these characteristics are estimated using likelihood mapping inside Euclidean space. A likelihood for all estimated feature vectors improves the model comprehensibility. (:Pleft[iright]) mentions the previous scale term that characterizes the importance of specific features in the earlier phases. Its description presented by Eq. (9):
The concept of (:gamma:) defines the correlation between the execution of a specific feature at the singular or through numerous decision points. After (:gamma:) equivalents (:1), the features are applied at the particular and numerous stages if (:gamma:) equivalents (:0). The AT model uses a method to (:identi)fy and select the essential characteristics, which are then applied to constructing the converted feature vector. This chosen feature is successively passed over the learnable Mask, signified as (:Mleft[jright]). The mask usage improves the model interpretability, and the FS method compared to the AT. The (:{j}^{th}) feature of the (:{b}^{th}) sample is described by (:{M}_{bj}left[jright].) If (:{M}_{bj}left[jright]) is equivalent to (:0), the feature fails to make some impact at that specific phase. The method of joining these masks at all iterations results in a coefficient, which allocates a value to the importance of all steps in a last determination.
While Multi-Layer Perceptron (MLP) and CNN vary in their structural design, generally, both methods depend upon neural networks32. CNNs use local networks, so every neuron is linked to an exact area of the preceding layer. Meanwhile, MLP uses FC structures, associating every neuron in the previous layer. Despite these structural differences, both structures aim to estimate functions utilizing fixed activation functions and learnable weights. CNNs are mainly appropriate for tasks connecting temporal or spatial correlations. It comprises numerous main components, including pooling, convolutional, and FC layers. The complete details of this layer are given below:
-
Convolutional Layer.
It is an essential module of CNN, mainly intended to mine local features from input data using kernels. It does element-wise multiplication among the filter and a local area, followed by summation, making feature maps that emphasize patterns like edges or textures, as exposed in Eq. (10).
Where (:{z}_{ij}) denotes an output value at location (:(i,j),) (:{K}_{mn}) refers to the weight of kernel at position (:(m,n)); (:{X}_{(i+m)(j+n)}) signifies an input value from a restricted area of input, and (:b) is similar to in MLPs.
This procedure is reiterated through an input, yielding a feature mapping that holds the spatial relations in the information while decreasing computation intricacy when equated to the FC layer.
-
Pooling layer.
This layer decreases the spatial sizes by combining data in the local areas, enhancing computational efficacy and delivering translation invariance. General pooling processes comprise choosing the max pooling or computing an average pooling from every local area:
Here, (:{y}_{pq}) refers to an output value at location (:(p,q),) (:{F}_{(p+m)(q+n)}) denotes an input value in the pooling window, and (:pool(bullet:)) represents the pooling process
Pooling decreases the resolution of the feature map while holding significant data, aiding in averting overfitting and reducing the computation load of succeeding layers.
-
FC layers.
It is the last phase in many neural network structures, altering the mined features into task-specific output. Every neuron is linked to each neuron in the preceding layer, permitting the system to merge and construe global data.
Here, (:{o}_{k}) represents an output of (:the:kth) neuron; (:{v}_{j}) refers to an input value from the (:jth) neuron; (:{W}_{kj}) represents a weight linking the (:jth) input neuron to (:the:kth) output neuron; and (:N) indicates several input neurons. FC layers unite features mined by the preceding layer into a complete representation, letting the system do many tasks such as regression, classification, etc. Owing to the vast parameters, these layers beat at learning higher-level representation by combining global features.
The combination of TabNet and CNN forms a unified method that influences the powers of both structures. TabNet handles organized metadata for identifying correlations and patterns, while CNN isolates contextual and semantic features from unstructured text. The hybrid method unites these perceptions to efficiently categorize and summarize social media content. Using TabNet + CNN, researchers and businesses can obtain actionable perceptions, decrease data overload, and improve decision-making procedures. The model’s interpretability and efficacy make it a perfect solution for summarizing real-time dissimilar and active social media data streams.
Performance validation
In this section, the experimental validation of the ASMHLN-SMDSCM technique is examined under the FIFA dataset33. Numerous features are included in the FIFA dataset, such as an index, time, and date. Every tweet was produced, the text content, the number of likes it obtained, the source platform, and the mood of the tweet. This dataset contains three classes: neutral with 2574 tweets, negative with 1804 tweets, and positive with 2622 tweets. The suggested technique is simulated using the Python 3.6.5 tool on PC i5-8600k, 250GB SSD, GeForce 1050Ti 4GB, 16GB RAM, and 1 TB HDD. The parameter settings are provided: learning rate: 0.01, activation: ReLU, epoch count: 50, dropout: 0.5, and batch size: 5. Table 1 represents the summarised text sample.
Table 2; Fig. 5 examine the classifier performance of the ASMHLN-SMDSCM method on the FIFA dataset through existing methodologies. The values of the table specify that the ASMHLN-SMDSCM method has gained efficacious performance. According to ROUGE-1, the ASMHLN-SMDSCM method has reached a better value of 70.23%, while Lead-3, SummaRuNNer, MFMMRBert Sum, and TFIDFGOFCCNN techniques have attained lower values of 33.36%, 34.68%, 43.31%, and 65.67%, correspondingly.

Classifier outcome of ASMHLN-SMDSCM model on FIFA dataset.
Likewise, according to ROUGE-2, the ASMHLN-SMDSCM approach has accomplished a better value of 68.79%. At the same time, Lead-3, SummaRuNNer, MFMMRBert Sum, and TFIDFGOFCCNN methods have gained diminished values of 34.70%, 47.00%, 40.36%, and 60.25%, respectively. Eventually, according to ROUGE-L, the ASMHLN-SMDSCM technique has reached a better value of 80.11%. At the same time, Lead-3, SummaRuNNer, MFMMRBert Sum, and TFIDFGOFCCNN approaches have attained minimal values of 45.22%, 31.35%, 45.92%, and 75.53%, correspondingly.
In Fig. 6, the training (TRA) (:acc{u}_{y}) and validation (VAL) (:acc{u}_{y}) performances of the ASMHLN-SMDSCM technique on the FIFA dataset are showcased. The values of (:acc{u}_{y}:)are computed across a period of 0–25 epochs. The figure underscored that the values of TRA and VAL (:acc{u}_{y}) present an increasing trend, indicating the proficiency of the ASMHLN-SMDSCM method with maximum performance across numerous repetitions. Moreover, the TRA and VAL (:acc{u}_{y}) values remain close through the epochs, notifying diminished overfitting and displaying the superior performance of the ASMHLN-SMDSCM method, which guarantees steady calculation on unseen samples.

(:Acc{u}_{y}) curve of ASMHLN-SMDSCM model on FIFA dataset
Figure 7 shows the TRA loss (TRALOS) and VAL loss (VALLOS) graph of the ASMHLN-SMDSCM method on the FIFA dataset. The loss values are computed throughout 0–25 epochs. The values of TRALOS and VALLOS demonstrate a diminishing trend, which indicates the competency of the ASMHLN-SMDSCM technique in harmonizing a tradeoff between generalization and data fitting. The succeeding dilution in values of loss and securities results in a higher performance of the ASMHLN-SMDSCM technique and gradually tunes the calculation results.

Loss curve of ASMHLN-SMDSCM model on FIFA dataset.
Table 3; Fig. 8 inspect the comparison study of the ASMHLN-SMDSCM approach on the FIFA dataset through the existing methodologies. The performances indicated that the BERT, CNNBiGRU, and GradBoost techniques have shown poorer performance. In the meantime, GPT-2 and GOFCCNN techniques have attained closer solutions. In addition, the ASMHLN-SMDSCM method noted maximum performance with higher (:pre{c}_{n}), (:rec{a}_{l},) (:acc{u}_{y},:)and (:{F1}_{score}) of 98.97%, 99.00%, 98.87%, and 98.95%, respectively.

Comparative analysis of the ASMHLN-SMDSCM model on the FIFA dataset.
In Table 4; Fig. 9, the processing time (PT) analysis of the ASMHLN-SMDSCM method on the FIFA dataset is presented through existing techniques. The performances imply that the ASMHLN-SMDSCM model gets minimal PT of 05.34 s while the BERT, GPT-2, CNNBiGRU, GradBoost, and GOFCCNN approaches gain better PT values of 11.29 s, 08.88 s, 07.61 s, 12.36 s, and 11.76 s, respectively.

PT outcome of ASMHLN-SMDSCM technique on FIFA dataset.
Also, the ASMHLN-SMDSCM technique is tested under the FARMER DEMONSTRATIONS dataset34. The user ID, medium, sentiment, source, mentioned users, quoted tweet, reply count, retweeted tweet, like count, and retweet count are attributes of this dataset. It contains 2080 positive, 1886 negative, and 3034 neutral sentiments. This vast database collects essential data for evaluating Twitter activities and approaches nearby farmer presentations. Table 5 depicts the samples of summarized text.
Table 6; Fig. 10 study the classifier analysis of the ASMHLN-SMDSCM method on the FARMER dataset through existing techniques. The values of the table imply that the ASMHLN-SMDSCM method has reached superior performance. According to ROUGE-1, the ASMHLN-SMDSCM method has a better value of 79.00%. At the same time, LANTENT, REGRESH, MFMMRBert Sum, and TFIDFGOFCCNN methodologies have accomplished diminished values of 43.95%, 35.73%, 53.32%, and 64.00%, respectively. Moreover, according to ROUGE-2, the ASMHLN-SMDSCM method has reached a better value of 80.03%, while LANTENT, REGRESH, MFMMRBert Sum, and TFIDFGOFCCNN methods have gained lower values of 54.42%, 54.86%, 43.61%, and 69.44%, correspondingly. Finally, according to ROUGE-L, the ASMHLN-SMDSCM method has reached a better value of 82.09%, while LANTENT, REGRESH, MFMMRBert Sum, and TFIDFGOFCCNN techniques have accomplished decrease values of 55.81%, 50.70%, 39.71%, and 78.76%, correspondingly.

Classifier outcome of ASMHLN-SMDSCM model on FARMER dataset.
Figure 11 shows the TRA and VAL (:acc{u}_{y}) performances of the ASMHLN-SMDSCM approach on the FARMER dataset. The values of (:acc{u}_{y}:)are computed through a period of 0–25 epochs. The figure underscored that the TRA and VAL (:acc{u}_{y}) values show a cumulative tendency, indicating the capacity of the ASMHLN-SMDSCM technique with higher performance through multiple repetitions. In addition, the TRA and VAL (:acc{u}_{y}) values remain close across the epochs, notifying lesser overfitting and displaying the improved performance of the ASMHLN-SMDSCM technique, which ensures reliable calculation on unseen samples.
Figure 12 illustrates the TRALOS and VALLOS graph of the ASMHLN-SMDSCM technique on the FARMER dataset. The loss values are computed across a period of 0–25 epochs. It signifies that the values of TRALOS and VALLOS represent a declining tendency, which notifies the competency of the ASMHLN-SMDSCM method in equalizing a tradeoff among generalization data fittings. The successive dilution in values of loss and securities results in the superior performance of the ASMHLN-SMDSCM method and tuning of the calculation results afterwards.

(:Acc{u}_{y}) curve of ASMHLN-SMDSCM model on FARMER dataset

Loss curve of ASMHLN-SMDSCM model on FARMER dataset.
Table 7; Fig. 13 inspect the comparison study of the ASMHLN-SMDSCM method on the FARMER dataset through the existing methodologies12,35,36. The proposed ASMHLN-SMDSCM method noted enhanced performance with improved (:pre{c}_{n}), (:rec{a}_{l},) (:acc{u}_{y},:)and (:{F1}_{score}) of 96.90%, 98.02%, 98.55%, and 98.91%, respectively. Afterwards, the existing techniques, namely BERT, GPT-2, CNNBiGRU, GradBoost, and GOFCCNN approaches, have attained the poorest performance.

Comparative analysis of ASMHLN-SMDSCM model on FARMER dataset.
Table 8; Fig. 14 exemplify the PT study of the ASMHLN-SMDSCM technique on the FARMER dataset through existing methodologies. The performances indicate that the ASMHLN-SMDSCM technique gets a minimal PT of 10.85 s while the BERT, GPT-2, CNNBiGRU, GradBoost, and GOFCCNN models attain improved better PT values of 17.07 s, 20.68 s, 19.18 s, 22.21 s, and 20.15 s, respectively, they also demonstrate improved (:acc{u}_{y}) in text classification and summarization tasks.

PT outcome of ASMHLN-SMDSCM technique on FARMER dataset.
Conclusion
In this manuscript, a new ASMHLN-SMDSCM technique is developed. The main intention of the proposed ASMHLN-SMDSCM model is to present a novel approach for text summarization on social media using advanced DL models. To accomplish that, the proposed ASMHLN-SMDSCM model applies text pre-processing, which contains dissimilar levels deployed to handle unprocessed data. The BERT model has been deployed for the feature extraction process. Furthermore, the MSA-based hyperparameter selection process is performed to optimize the feature extraction results of the BERT model. Finally, the classification process is performed using the TabNet + CNN model. The efficiency of the ASMHLN-SMDSCM method is validated by comprehensive studies using the FIFA and FARMER datasets. The experimental validation of the ASMHLN-SMDSCM method illustrated a superior accuracy value of 98.87% and 98.55% over recent techniques. The limitations of the ASMHLN-SMDSCM method comprise a narrow focus on specific data sources, which may limit the generalizability of the findings to wider contexts. Furthermore, the models used may not perform optimally with highly diverse or noisy data, such as real-time social media content. The lack of robustness in handling long-text inputs and complex semantic relationships also affects the performance of the model in certain tasks. Moreover, the computational cost of training such models remains high, which may restrict scalability. Future work could explore the incorporation of more diverse data sources, optimization of model efficiency, and the inclusion of multimodal data to improve performance. Additionally, enhancing interpretability and real-time applicability in dynamic environments would be valuable directions for future research.
Data availability
The data that support the findings of this study are openly available in Kaggle repository at https://www.kaggle.com/datasets/tirendazacademy/fifa-world-cup-2022-tweets and https://www. kaggle.com/datasets/prathamsharma123/farmers‑protest‑tweets‑dataset‑csv, reference number23.
References
-
Ghanem, F. A., Padma, M. C. & Alkhatib, R. Automatic short text summarization techniques in social media platforms. Futur Internet. 15, 311 (2023).
-
Budak, M. M., Sert, M. F. & Durmaz, I. Y. Analyzing the United Nations Speeches with a Neutrosophic Approach to Text Mining in The Context of Türkiye’s Foreign Policy. Int. J. Neutrosophic Sci. (IJNS), 22(3). (2023).
-
Huang, Y., Shen, C. & Li, T. Event summarization for sports games using Twitter streams. World Wide Web. 21, 609–627 (2018).
-
Rahman, M. M. & Siddiqui, F. H. An optimized abstractive text summarization model using peephole convolutional LSTM. Symmetry, 11(10), 1290 (2019).
-
Rudrapal, D., Das, A. & Bhattacharya, B. A. New approach for Twitter event summarization based on sentence identification and partial textual entailment. Comput. Y Sist. 23, 1065–1078 (2019).
-
AbdelSalam, S. & Rafea, A. Performance study on extractive text summarization using BERT models. Information 13, 67 (2022). [CrossRef].
-
Rudra, K., Goyal, P., Ganguly, N., Imran, M. & Mitra, P. Summarizing situational tweets in crisis scenarios: an extractive abstractive approach. IEEE Trans. Comput. Soc. Syst. 6, 981–993 (2019).
-
Kumar, N. V. & Reddy, M. J. Factual instance tweet summarization and opinion analysis of sport competition. In Advances in Intelligent Systems and Computing. Vol. 898. 153–162 (Springer, 2019).
-
Rahman, M. M. & Siddiqui, F. H. Multi-layered attentional peephole convolutional LSTM for abstractive text summarization. ETRI J. 43 (2), 288–298 (2021).
-
Han, Y., EL-Hasnony, I. M. & Cai, W. Dragonfly algorithm with gated recurrent unit for cybersecurity in social networking. Full Length Article 2, 75 – 5 (2021).
-
Joshi, A., Fidalgo, E., Alegre, E. & Fernández-Robles, L. DeepSumm: Exploiting topic models and sequence to sequence networks for extractive text summarization. Expert Syst. Appl. 211, 118442 (2023).
-
Ghanem, F. A., Padma, M. C., Abdulwahab, H. M. & Alkhatib, R. Novel genetic optimization techniques for accurate social media data summarization and classification using deep learning models. Technologies 12(10), 199 (2024).
-
Yin, K., Liu, C., Mostafavi, A. & Hu, X. Crisissense-llm: Instruction fine-tuned large language model for multi-label social media text classification in disaster informatics. ArXiv Preprint arXiv:240615477 (2024).
-
Anoop, V. S., Krishna, C. S. & Govindarajan, U. H. Graph embedding approaches for social media sentiment analysis with model explanation. Int. J. Inf. Manag. Data Insights 4(1), 100221 (2024).
-
Li, H., Yang, W., Wang, W. & Wang, H. Harmfulness metrics in digital twins of social network rumors detection in cloud computing environment. J. Cloud Comput. 13(1), 36 (2024).
-
Gong, S. H., Teng, J., Duan, C. Y. & Liu, S. J. Framework for evaluating online public opinions on urban rail transit services through social media data classification and mining. Res. Transport. Bus. Manag. 56, 101197 (2024).
-
Paul, J., Roy, A., Mitra, A. & Sil, J. HyV-Summ: Social media video summarization on custom dataset using hybrid techniques. Neurocomputing 614, 128852 (2025).
-
Ghanem, F. A., Padma, M. C. & Alkhatib, R. Elevating the precision of summarization for short text in social media using pre-processing techniques. In 2023 IEEE International Conference on High Performance Computing & , Communications, Data Science & Systems, Smart City & Dependability in Sensor, Cloud & Big Data Systems & Application (HPCC/DSS/SmartCity/DependSys). 408–416. (IEEE, 2023).
-
Indian, A., Manethia, P., Meena, G. & Mohbey, K. K. Decoding emotions: Unveiling sentiments and sarcasm through text analysis. In International Conference on Deep Learning, Artificial Intelligence and Robotics. 714–731. (Springer, 2023).
-
Capatina, A., Micu, A., Micu, A. E. & Ribeiro-Navarrete, S. Knowledge maps for large‐scale group decision making in social media content analysis. Expert Syst. 42 (1), e13509 (2025).
-
Meena, G., Mohbey, K. K. & Indian, A. Categorizing sentiment polarities in social networks data using convolutional neural network. SN Comput. Sci. 3(2), 116 (2022).
-
AbdelAziz, N. M., Ali, A. A., Naguib, S. M. & Fayed, L. S. Clustering-based topic modeling for biomedical documents extractive text summarization. J. Supercomput. 81(1), 171 (2025).
-
Kumar, T., Mahrishi, M. & Meena, G. A comprehensive review of recent automatic speech summarization and keyword identification techniques. In Artificial Intelligence in Industrial Applications: Approaches to Solve the Intrinsic Industrial Optimization Problems. 111–126 (2022).
-
Khan, L., Qazi, A., Chang, H. T., Alhajlah, M. & Mahmood, A. Empowering Urdu sentiment analysis: an attention-based stacked CNN-Bi-LSTM DNN with multilingual BERT. Complex Intell. Syst. 11(1), 10 (2025).
-
Cui, W. & Shang, M. Fake news detection with multimodal interaction and graph contrastive learning networks. Appl. Intell. 55 (1), 1–23 (2025).
-
Vinitha, M. & Vasundra, S. An efficient ant colony optimization optimized deep belief network based text summarization using diverse beam search computation for social media content extraction. Int. J. Intell. Eng. Syst., 17(6). (2024).
-
Arjaria, S. K. et al. Predicting rumors spread using textual and social context in propagation graph with graph neural network. In Natural Language Processing for Software Engineering. 389–402 (2025).
-
Rautaray, J., Panigrahi, S. & Nayak, A. K. Integrating particle swarm optimization with Backtracking search optimization feature extraction with two-dimensional convolutional neural network and attention-based stacked bidirectional long short-term memory classifier for effective single and multi-document summarization. PeerJ Comput. Sci. 10, e2435 (2024).
-
Xiong, Y., Wei, N., Qiao, K., Li, Z. & Li, Z. Exploring Consumption Intent in Live E-Commerce Barrage: A Text Feature-Based Approach Using Bert-BiLSTM Model. (IEEE Access, 2024).
-
Sun, S., Su, Y., Yin, C. & Jermsittiparsert, K. Optimal parameters Estimation of PEMFCs model using converged moth search algorithm. Energy Rep. 6, 1501–1509 (2020).
-
Khattak, A., Zhang, J., Chan, P. W. & Chen, F. Assessment of wind shear severity in airport runway vicinity using interpretable TabNet approach and Doppler LiDAR data. Appl. Artifi.Intell. 38(1), 2302227 (2024).
-
Pei, Z. et al. KAN–CNN: A novel framework for electric vehicle load forecasting with enhanced engineering applicability and simplified neural network tuning. Electronics 14(3), 414 (2025).
-
https://www.kaggle.com/datasets/tirendazacademy/fifa–world–cup–2022–tweets
-
https://www.kaggle.com/datasets/prathamsharma123/farmers–protest–tweets–dataset–csv
-
Fan, J. et al. Extractive social media text summarization based on MFMMR-BertSum. Array, 20, 100322 (2023).
-
Kwon, O. H. et al. Sentiment analysis of the United States public support of nuclear power on social media using large language models. Renew. Sustain. Energy Rev. 200, 114570 (2024).
Acknowledgements
The authors extend their appreciation to the Deanship of Research and Graduate Studies at King Khalid University for funding this work through Large Research Project under grant number RGP2/104/45. Princess Nourah bint Abdulrahman University Researchers Supporting Project number (PNURSP2025R723), Princess Nourah bint Abdulrahman University, Riyadh, Saudi Arabia. Researchers Supporting Project number (RSPD2025R714), King Saud University, Riyadh, Saudi Arabia. The authors extend their appreciation to Northern Border University, Saudi Arabia, for supporting this work through project number (NBU-CRP-2025-2903).
Author information
Authors and Affiliations
Contributions
Reema G AL-anazi: Conceptualization, methodology development, experiment, formal analysis, investigation, writing. Muhammad Swaileh A. Alzaidi: Formal analysis, investigation, validation, visualization, writing. Majdy M. Eltahir: Formal analysis, review and editing. Hassan Alkhiri : Methodology, investigation. Samah Hazzaa Alajmani: Review and editing.Mohammed Alshahrani: Discussion, review and editing. Nawaf Alhebaishi: Discussion, review and editing. Abdulbasit A. Darem: Conceptualization, methodology development, investigation, supervision, review and editing.All authors have read and agreed to the published version of the manuscript.
Corresponding author
Ethics declarations
Competing interests
The authors declare no competing interests.
Additional information
Publisher’s note
Springer Nature remains neutral with regard to jurisdictional claims in published maps and institutional affiliations.
Rights and permissions
Open Access This article is licensed under a Creative Commons Attribution-NonCommercial-NoDerivatives 4.0 International License, which permits any non-commercial use, sharing, distribution and reproduction in any medium or format, as long as you give appropriate credit to the original author(s) and the source, provide a link to the Creative Commons licence, and indicate if you modified the licensed material. You do not have permission under this licence to share adapted material derived from this article or parts of it. The images or other third party material in this article are included in the article’s Creative Commons licence, unless indicated otherwise in a credit line to the material. If material is not included in the article’s Creative Commons licence and your intended use is not permitted by statutory regulation or exceeds the permitted use, you will need to obtain permission directly from the copyright holder. To view a copy of this licence, visit http://creativecommons.org/licenses/by-nc-nd/4.0/.
About this article

Cite this article
AL-anazi, R.G., Alzaidi, M.S.A., Eltahir, M.M. et al. An adaptive search mechanism with convolutional learning networks for online social media text summarization and classification model.
Sci Rep 15, 11058 (2025). https://doi.org/10.1038/s41598-025-95381-4
-
Received:
-
Accepted:
-
Published:
-
DOI: https://doi.org/10.1038/s41598-025-95381-4
Keywords
This post was originally published on this site be sure to check out more of their content