


Abstract
Malicious actors regularly attempt to manipulate social media using coordinated posting. Many existing methods for detecting this coordination, though, have relied primarily on post-timing, which is trivially easy to change. In this paper, we make a significant methodological advancement in coordination detection, leveraging highly regular statistical patterns in the speed and frequency of sharing. We apply and validate this approach on Facebook, using 11.2 million link posts from a list of 16,169 most popular English-language Facebook pages that referenced at least one of the top eight US politicians in any post, a set of pages that produced more than 91% of all user engagement in this category during our collection period. Our approach can be calibrated and adapted across contexts, platforms, and times, allowing researchers to build valid, testable, but still human-interpretable models of platform manipulations.
Introduction
Malicious actors with political or financial motives now regularly try to manipulate social media using coordinated campaigns. Previous research and journalistic reports have shown that foreign governments1,2, domestic political organizations3, anti-vaccination groups4, and right-wing media websites5,6 set up multiple social media accounts or pay their supporters to amplify content, disrupt conversations, and direct traffic to certain websites. Many such coordination efforts, especially when they operate in the shadows or spread misinformation, can present serious challenges to democratic self-governance.
Since 2016, when Russian interference in the 2016 U.S. presidential election brought much-needed attention to the subject7,8,9,10,11, estimating the prevalence of platform manipulation, of which coordinated link sharing is a key subcategory, has become a key research priority. A great deal of work has focused on developing methods to detect coordination on Twitter, leveraging the features of user profile, temporal patterns of user interactions, content similarity, or network features. For example, one study showed that coordinated accounts might use similar handles, share the same images, post hashtags in identical sequence, or post messages in close temporal proximity12; similarly, another study focused on matching users who mention the same hashtag, repost, or reply to the same original post13; a third study examined synchronized actions in sharing common hashtags, URLs, and mentions14; and a fourth study analyzed user profile and hashtag usage similarity15. Two more studies analyzed network features – one focused on co-retweet, co-URL, hashtag sequence, fast retweet, and text similarity16and the other focused on co-retweet and superspreaders17.
Yet, fewer studies examined coordination on Facebook, the most used social media platform in the world. Existing approaches have focused on the fast sharing of identical link posts. For example, defining coordination as “near-simultaneous sharing,” Giglietto et al., (2020) regarded two pages as engaging in coordination if they shared the same link post below the median time of 10% of the quickest URL shares in their data set in the 2018 and 2019 Italian election. Studying the spread of misinformation in the Covid-19 pandemic, Ayers et al., (2021) considered two groups as using automated software to disseminate content if they shared identical links more than five times and at least half of those links were posted within less than 10 seconds18.
Existing approaches to detecting coordination on Facebook have a fundamental limitation, namely that the time thresholds for identifying coordination depend strongly on the specific context of the study. Previous work assumes, without evidence, that the threshold that supposedly “worked” for Italian elections or the pandemic is still applicable across different contexts or time periods. However, this assumption is unlikely to hold true, as malicious actors can easily manipulate the time window for coordinated sharing in different contexts, a phenomenon already documented on Twitter since 2016. For example, one study found that hundreds of accounts tweeted the same hashtag in unison with a six-hour delay between tweets11; another study on Russia’s influence campaign on Twitter found that the time delay between the sharing of the same content by two coordinated accounts could go above six hours2. Missing large volumes of coordinated sharing due to using a too-short interval derived from a specific context would be particularly consequential because omitted content may disproportionately come from more sophisticated and better-resourced manipulation campaigns. As a practical goal, we need to develop better techniques that cut across different contexts so that we can better mitigate and measure the manipulative activity we know is taking place.
In this paper, we make a significant methodological advancement in coordination detection. We operationalize coordination between two social media accounts based on two criteria – whether they posted identical links too quickly or too frequently (or both) to be the result of chance. To identify coordinated sharing vs. normal sharing in our data, we fit a mixture of exponential distributions to determine the time threshold and a mixture of negative binomial distributions to determine the frequency threshold. Because this method is based on the statistical patterns within a given data set, it can be appropriately applied to other contexts, time frames, and platforms.
We apply and validate this method by conducting the first systemic study that provides a near platform-wide estimate of coordinated link sharing among Facebook pages in the context of US politics. Drawing on recent research on long-tailed distributions19,20, we collected a large corpus that contains 11.24 million link posts from more than 16,000 of the highest-engagement English-language Facebook pages that referenced at least one of the top eight US political leaders (Trump, Pence, Biden, Harris, McCarthy, Pelosi, Schumer, and McConnell) in any post between January and April 2021. Our statistical models indicated that pages sharing the same link post within 27 seconds and/or more than 9 times likely engaged in coordination. We validated our methods by manually examining the pages. We found that large volumes of coordinated sharing occurred between pages publicly managed by the same organizational entity, such as news organizations with a single corporate owner. But we also discovered networks of coordination consisting of seemingly independent pages which were likely controlled by the same organizational entity.
Our method for coordination detection allows us to conduct rigorous sensitivity analysis about whether the thresholds derived from previous contexts really work. They may not. For example, using the previous time threshold of 10 seconds and the frequency threshold of 5 shares that were derived from a 2020 Covid-19 misinformation study on Facebook18 would have missed many coordination efforts among US politics-focused Facebook pages in 2021. The strength of our method is that it can be calibrated and adapted to other contexts as bad actors change their tactics, allowing us to demonstrate validity across platforms, across different content types, and across time. It can be applied not just to Facebook link posts we examined in this paper, but to other (sub)categories of content such as image posts or other social media platforms such as Twitter. Differing thresholds may be especially consequential when our classification approach combines inter-post timing with other features/predictors. There are likely to be interaction effects between multiple predictors. More broadly, choosing a better threshold contributes to the goal of building valid, testable, but still human-interpretable models of platform manipulation. Decisions about platform manipulation are a high-stakes context where interpretable models are critical for good decision-making.
Results
Identifying coordination
Previous studies20,21 used the time between two successive shares of the same link to identify near-simultaneous sharing. In other words, if two entities share the same link at roughly the same time, then they are considered to be engaging in near-simultaneous sharing. However, near-simultaneous sharing can be easily disguised by slowly sharing the same links over an extended period of time. Hence, the identification of coordination needs to take into account both the temporal dimension and the frequency of sharing.
We define coordinated link sharing in terms of 1.) the time between two successive shares of the same link post by two pages(we call it inter-arrival time) and 2.) the total number of identical link posts that two pages share during the three-month period. In other words, two pages are considered as coordinating with each other if they share the same link post quickly and/or repetitively. Our task is to identify two meaningful thresholds to distinguish fast sharing and repetitive sharing from normal sharing.
In the following paragraphs, we illustrate the steps to identify statistical patterns of coordination with regard to time and frequency in any given dataset, using our own data as an example. We provide details on how we collected the Facebook data from CrowdTangle in the materials and methods section.
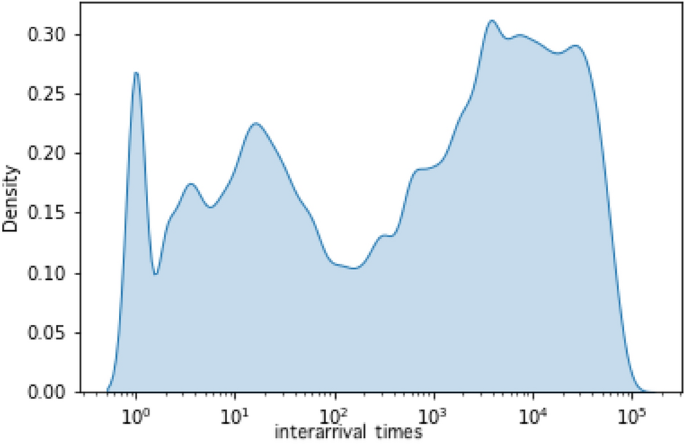
The first step is to visualize our time data in a density plot (see Figure 1), which shows the inter-arrival time between two consecutive shares of the same link. Figure 1suggests that there are at least six different data-generating processes, or rather six components in a mixture model. According to Okada et al., (2020)19, inter-arrival time is non-Poissonian and should obey a mixture of exponential distributions with different parameter values. A 2022 study by Broniatowski and colleagues20 fit exponential mixture models to inter-arrival time data based on three Facebook data sets and showed promising results. Following their approach, we use a mixture of exponential distributions to fit our inter-arrival data.
We used the Exponential Mixture Model (EMM) package in Python to fit a mixture of exponential distributions to our data, where we set the range of k components between 6 and 10 (The Python package EMMs can be found at https://github.com/naokimas/exp_mixture_model). Next, we used Decomposed Normalized Maximum-likelihood Codelength (DNML) as a criterion to select the best model19. Last, we identified the threshold where the first component and the second component intersect. Table S2 shows the performance of different models with k ranging from 6 to 10. Table S3 shows the model parameters for the best model.

Density plot for inter-arrival time between two successive shares of identical links.

Cumulative Distribution Function (CDF) of time data vs. that of the mixture exponential model (from trial 1).
It should be noted that there is some randomness in EMMs’ model fitting. To mitigate this issue, we repeated this model fitting process five times and averaged the thresholds (See Table S4). We found that the first and second exponential distribution intersected at 27 seconds on average, which means that two successive shares of one identical link with 27 seconds apart are equally likely to have come from either the first or second exponential distribution. We treated 27 seconds as the threshold of fast sharing. Figure 2 shows the Cumulative Distribution Function of the inter-arrival time data vs that of the mixture exponential model (trial 1). In SI, we provide further details on each model and the results from the two sample Kolmogorov-Smirnov goodness-of-fit tests.

Density plot for the number of identical links shared by two pages.

Cumulative Distribution Function (CDF) of frequency data vs that of the mixture negative binomial model (trial 1).
Fitting the frequency data followed a similar procedure. Figure 3 shows the distribution of the number of identical links that two pages shared over the three-month period. The data shown in Figure 3 suggest a mixture of two over-dispersed distributions, so we fit a two-component mixture of negative binomial distributions using the SciPy package in Python and repeated the process five times (See Table S5). Each time, the model suggests that the threshold should be at 5. Using the model from the fifth trial, we estimated the probability of the number of identical links (k) ranging from 1 to 15 in the first and second component respectively. As Table S6 shows, the probability of k being in either component becomes the same when k is equal to 5. More importantly, the probability of k in the first negative binomial distribution decreases to zero as k increases to 9. This means that the co-share frequency equal to or above 9 must come from the second negative binomial distribution. To minimize false positives, we used 9 instead of 5 as the threshold for repetitive sharing. Figure 4 shows the Cumulative Distribution Function of the frequency data vs that of the mixture negative binomial model. In SI, we provide further details on the model and the result from the two sample Kolmogorov-Smirnov goodness-of-fit test.
The scale of coordinated link sharing
Of the total 11.24 million links posted by 16,169 pages, 7.8% of the links were co-shared by 71.4% of the pages (see Table 1 for the detail). Figure 5 shows the scatter plot where each dot represents a pair of pages that share at least one identical link. The X-axis represents the total number of identical links shared between two pages over the three-month period, and the Y-axis shows the average inter-arrival time of two successive shares of identical links between a pair of pages. The color scheme in Figure 5 and Figure 6 shows three types of coordinated sharing – fast sharing (orange), repetitive sharing (yellow), and fast and repetitive sharing (red). By fast sharing, we mean the pairs of pages that shared at least two identical links with an average inter-arrival time equal to or less than 27 seconds. By repetitive sharing, we mean the pairs of pages that shared 9 or more identical links over the three-month period. By fast and repetitive sharing, we mean the pairs of pages that shared 9 or more identical links with an average inter-arrival time equal to or less than 27 seconds over the three-month period. The blue dots in Figure 5 are assumed to represent normal or organic sharing. Table 2 summarizes the statistics of each type of coordinated sharing (We assume that two pages if coordinating with each other, share identical links within a day. This means that we did not capture any coordinated link sharing that went beyond the one-day window).
Overall, we found that 5.5% of the links and 23% of the pages were involved in coordinated sharing as shown in Table 1. 4.07% of the pages were involved in fast sharing where 0.04% of the links were shared with an average inter-arrival time of 5.22 seconds. Repetitive sharing dominated all forms of coordinated sharing – 20.47% of the pages were involved in repetitive sharing that co-shared 4.39% of the links in total (see Table 2). Importantly, the average inter-arrival time for repetitive sharing is (approx) 2 hours (i.e., 7,828.7 seconds), reinforcing concerns that identical links shared slowly may be able to avoid detection. It is important to note that a Facebook page could be included in all three categories if it engaged in fast sharing with one page, repetitive sharing with another, and both fast and repetitive sharing with a third. Consequently, the counts for fast sharing, repetitive sharing, and combined fast and repetitive sharing in Table 2 are not mutually exclusive.

Visualization of link sharing behavior on Facebook. Mean inter-arrival time vs. number of identical links shared (logarithmic scale) showing different types of coordination.

Co-sharing network with corresponding color codes showing different types of coordination. In the co-sharing network, nodes represent Facebook pages and an edge exists between two nodes if they share at least one identical link.
Top web domains shared in coordination
We ranked each web domain based on the number of coordinated links it received from Facebook pages. Among 3,264 domains to which links were shared in coordination, the top 400 domains altogether received 564,007 links, approximately 91% of all coordinated link sharing in our data. Hence, our following analysis focuses on the top 400 domains.
First, a significant number of URLs shared in coordination were directed to non-political domains. We coded each domain in terms of whether it included political content. We first used Media Bias Fact Check (MBFC), a fact-checker that has been used by researchers to classify 22,23,24,25 political news sites. Among the top 400 domains, 255 were not identified by MBFC in 2021. Then, we followed Guess et al., (2021) to define a political news site as a site that covers news about government officials, institutions, and public policies26. We manually coded the 255 domains (Two coders coded a random sample of 100 sites independently with Krippendorff’s Alpha at 0.959). We found 147 non-political sites, which received 256,581 coordinated links that accounted for 45.5% of all links to top domains. The top five non-political sites that received the most coordinated links are wegotthiscovered.com (entertainment), totalprosports.com (sports), classiccountrymusic.com (music), countrymusicfamily.com (music), and popculture.com (entertainment).
Second, right-wing political domains accounted for a majority of all URLs that were shared in coordination to political domains. We used MBFC to categorize the partisan lean of the remaining 142 political news sites. 18 were classified as center-right, 38 center-left, 24 center (least biased), 17 left, 24 right, 6 extreme left, and 15 extreme right. Table S13 in SI shows the names of the domains in each partisanship category. The partisanship category that received the most coordinated links is center-right (24%), followed by right (22%), center-left (20%), center (16%), extreme right (9%), left (5%), and extreme left (4%). The three right-leaning categories combined – namely extreme right, right, and center-right – received more than 54% of all coordinated links to the 142 political news sites while the three left-leaning categories combined only received 28% of the total links (see Table 3).
We also collected the list of domain names (n=755) marked as ’Questionable’ and ’Conspiracy’ from MBFC. Links to domains labeled as “Questionable” by MBFC represented only a small portion of the coordinated sharing identified in our dataset. According to MBFC, questionable sources exhibit extreme bias, propaganda/conspiracies, poor or no sourcing to credible information, a complete lack of transparency and/or are fake news. After cross-checking those domains among the top 400 domains, we found that 23,274 links (from 24 domains) shared in coordination came from “Questionable” sources. They account for 4.1% of all coordinated sharing of links to top domains.
Finally, links to domains labeled as “Conspiracy” by MBFC were minimal. According to MBFC, Conspiracy sources may publish unverifiable information that is not always supported by evidence. After cross-checking those domains among the top 400 domains, we found that 2,248 links (from 2 domains) shared in coordination came from “Conspiracy” sources. They account for 0.4% of all coordinated sharing of links to top domains.
Examples of coordination networks
Using this method, we identified several networks of coordination. First, large volumes of coordinated sharing occurred between pages that were publicly managed by the subsidiaries of a single corporate entity, according to the corporation’s website. Many of the sharing activities were directed at amplifying the company’s content. Here we present three examples, namely Hearst, Gray TV, and Epoch Media. The Hearst network (See Figure S1 in SI) consists of 28 pages – each represents a TV station or radio station owned by Hearst. They shared 4,797 identical links to their own web domains with an average inter-arrival time at 154.83 seconds (See Table S7 in SI). The Gray TV network (See Figure S2 in SI) consists of 33 pages – each represents a TV station or radio station owned by Gray TV. They shared 2,656 identical links to their own web domains with an average inter-arrival time at 320.37 seconds (See Table S7 in in SI). The Epoch Media network (See Figure S3 in SI) consists of two organizational entities, namely The Epoch Times and New Tang Dynasty TV which set up 14 pages. These pages shared 15,838 identical links to ntd.com and theepochtimes.com with an average inter-arrival time at 90.16 seconds, a much faster pace than the Hearst or the Gray TV network (See Table S7 in SI).
In addition, we discovered several covert coordination networks, which shared identical links among seemingly independent pages that were likely controlled by the same organizational entity or individuals. Some of the coordinated link sharing was predominantly directed at a single web domain, a sign of deliberate efforts to artificially boost that domain’s web traffic. Here we present three examples of covert coordination networks. The Aurora Media network, which owns Political Insider, Tell Me Now, and other online publications, regularly shared identical links to its content (Figure S5). This network shared 3,621 identical links with an average inter-arrival time at 11.08 seconds. 3,598 of these links went to three Aurora owned domains (Table S8). Another example is the 100 Percent Fed Up network, which consists of “Rush Limbaugh Radio,” a page that had nothing to do with Rush Limbaugh or radio (Figure S6). This network shared 1,534 identical links, 1,532 of which went to 100percentfedup.com, with an average inter-arrival time at 37.16 seconds (Table S8). The third example is the Dorr brothers network, a group of seemingly locally-run gun rights NGOs across multiple states that were in fact set up and managed by three individuals – Chris Dorr, Ben Dorr, and Aaron Dorr (Figure S4). This network shared 711 identical links with an average inter-arrival time at 18.34 seconds. According to the Daily Beast’s reporting, the Dorr brothers used the NGOs to solicit donations and then directed the money to their own consulting firm. Accused by the National Rifle Association (NRA) as “scam artists,” the Dorr brothers made millions of dollars from this network of gun rights NGOs27.
These six examples of coordination networks are by no means exhaustive. But they show that our methods successfully identified both overt and covert networks of coordination that quickly and/or repeatedly shared identical links. For a complete list of top ten largest coordination networks for each type of coordination, see Table S10–S12 in SI.
Discussion
Our paper makes two key contributions. First, our method is a significant improvement over previous approaches. It lays the statistical foundation for distinguishing coordinated sharing from organic sharing, and therefore can be calibrated and adapted to different contexts, platforms, and content types.
Second, our method represents the first attempt to offer near-platform-wide coverage for detecting coordination on Facebook within the U.S. political context. Consistent with previous work that found large-scale coordination efforts among Facebook pages during 2018 and 2019 Italian elections21, we found that more than 22.9% of the 16,169 most popular English language-based pages that referenced top US politicians were involved in coordination. As we show below in the Method’s list construction subsection, engagement on Facebook is strongly concentrated on popular pages – top 9,505 pages were estimated to account for more than 91% of the total engagement generated by all similar pages during the study period. The fact that coordinated sharing is a relatively common practice among the most popular Facebook pages that dominated audience engagement put into question any claims that the so-called “marketplace of ideas” on Facebook provides a diverse information diet for its users.
Similar to Giglietto et al. (2020), our study identified both political and non-political coordination networks. However, our additional analysis of web domains revealed that right-wing political domains accounted for nearly twice as many URLs shared in coordination as left-wing political domains. This finding is consistent with previous research that showed partisan asymmetry in the sharing of information on Facebook28.
Our approach is designed to be agnostic to the specific mechanisms or decision-making processes that led to coordination, aiming to capture any type of sharing behavior that is statistically unlikely to be organic. Our findings can serve as an upper bound on the plausible range of coordinated sharing, which platform content moderators can use for further investigation. This means our tally includes sharing among different organizations owned by the same corporation, among different pages set up by the same individuals, and among groups that share similar interests or political ideologies. Some coordinated sharing seems harmless, such as the promotion of the same story across multiple pages owned by the same newspaper chain. We should note that it is reasonable to expect overt networks, like Gray TV, to engage in coordinated sharing of identical links. However, it is still important to identify those coordination patterns, as the scale and speed of such coordinated sharing can still impact the information ecosystem and user experiences on Facebook.
We developed the method with the intention that other computational social scientists could apply it across various social media platforms. However, since we wrote our paper in 2021, accessing certain social media data has become increasingly challenging. In 2023, X (formerly Twitter) ended free access to its academic API, and in 2024, Meta shut down CrowdTangle, replacing it with the Meta Content Library, a tool that has seen limited use since its launch. In light of these developments, we offer three suggestions for researchers aiming to replicate our study. First, prioritize platforms where data is easy to access. In 2024, the EU Digital Services Act (DSA) took effect, mandating that very large online platforms (VLOPs) provide researchers with access to public data. Despite this requirement, researchers continue to face significant obstacles, even as platforms like YouTube, TikTok, Reddit, and Meta have made data access available. For instance, YouTube’s research program restricts access to scholars affiliated with eligible academic institutions, while TikTok requires a 30-day pre-publication review of any research findings29,30. Second, consider forming partnerships with platforms directly if such opportunities present themselves (e.g., the Facebook 2020 election project). Third, develop data-scraping tools to collect data where it is legal and ethical.
We would note two limitations to our study. First, we did not capture potential coordinated link sharing outside the one-day window. The complexity of the analysis grows exponentially with the number of posts. Constructing the edge list based on a 7-day weekly window (for example) is roughly 49 times as computationally intensive as a window based on a single day. Previous research has established that most activity focused on a news story or a news topic occurs within the first few hours31,32. Coordinated posts may not be typical, though, so future work should attempt to replicate this analysis over longer time horizons.
Second, our analysis focused solely on the co-sharing of identical link posts by Facebook pages, without accounting for content similarity – such as co-sharing of similar links or images. The rapid deployment of generative AI models since our initial collection period may make it far easier to operate coordinated campaigns based on similar, but not identical, images and articles. Another potentially useful feature for detecting coordination, not explored in our paper, is the follower/following network. If CrowdTangle had provided this data, it would have been possible to construct a network among Facebook pages or a bipartite network based on pages’ common followers. However, constructing this follower/following network of Facebook pages would require a different dataset and approach from the one used in our study, making it an urgent area for future research.
Methods
List construction
We created a master list of approximately 145,000 English-language based (loosely defined by CrowdTangle) US political pages. We define a US political page as any page that mentions at least one of the top leaders in the White House or US Congress between January and February 2021. They are former President Donald Trump, former Vice President Mike Pence, President Joe Biden, Vice President Kamala Harris, former US House Speaker Nancy Pelosi, US House Speaker Kevin McCarthy, Senate Majority Leader Chuck Schumer, and Senate minority leader Mitch McConnell. During this transitional period, these politicians not only held significant political influence but also shaped the national agenda in pivotal ways. For example, Trump and Pence, as outgoing leaders, were central to the tumultuous transfer of power, particularly in the wake of the January 6 Capitol riot. Biden and Harris, as incoming leaders, represented a dramatic shift in leadership. Pelosi, McCarthy, Schumer, and McConnell, as leaders in Congress, were key players in legislative battles and the certification of the 2020 election results. Collectively, they became major subjects of political news coverage and discussion during the time. It stands to reason that any Facebook pages focused on US politics must have mentioned at least one of these politicians’ names at least one time in its content in the first two months of 2021. This method allowed us to identify an almost complete set of Facebook pages focused on U.S. politics.
We first used the search function and language filter in CrowdTangle and downloaded 1.6 million English language posts that mentioned the names. We then aggregated the posts at the page level and created the 145,000 page master list. Next, we queried CrowdTangle’s API to collect the total interactions (i.e., engagement) for each page on the master list between January 1 and February 28, 2021. Then, we ordered the pages based on the interactions metric and selected the top 20,000 pages, which accounted for 97.6% of all the engagement for the 145,000 pages. Moreover, we took an extra step to ensure that we focus on English-only pages. First, we collected all posts from each page over a 72-hour window. For each post, we appended message text, image text, caption, description, and title and classified the post’s language using the Python langdetect language-detection library. However, if the posts are fewer than 100 characters, Python langdetect is known to be less reliable. Hence, we use Google Translate online API to reclassify the shorter posts. This was done only for the pages that have fewer than 20 longer posts (greater than 100 characters). If more than 20 posts pass the 100-character length threshold for a page, we discard the shorter posts because we believe that a large enough sample of longer posts is available for that page. We classified a page as English if its English posts were over 90% of its total posts. This method produced a short list of 16,169 English pages.
Our data produced by the pages on the shortlist represent more than 90% of all engagements generated by English-language pages that mentioned one of the eight US politicians on the entire Facebook platform between January and February 2021. We calculated our estimate in the following steps. First, our data source, CrowdTangle, includes all pages with more than 50 K likes/followers, as well as many smaller pages with less than 50k likes/followers. This means that our master list includes every Facebook page with over 50 K page likes that mentioned the top US politicians. Ranked by the number of page likes, we found that the 9505th page was the cut-off point with 50,036 page likes. From the 9506 th page, the page likes started to drop below 50,000.
Next, to estimate the engagement generated by smaller pages with fewer than 50,000 page likes, which we do not have full coverage, we plotted engagement against rank (based on page likes) on a log-log scale for the top 9,505 pages. As Figure 7shows, the relationship between rank and engagement approximates a power-law shape33. Then, we used a cubic polynomial regression in R to model the relationship (See Table S1 in SI for details). In Figure 7, the blue line represents point estimates and the shaded area represents confidence intervals. Last, we used the model to predict engagement starting from the (9506^{th}) page. For robustness check, we also fitted a second-degree polynomial (See Table S1).

Engagement for top 9505 pages.
We found that the 9,505 pages accounted for more than 91% of the total engagement generated by all similar pages on Facebook during the same period. The result is robust to different estimates of the total number of similar pages on Facebook. Assuming the least popular page had just more than 1 interaction between January and February, then the total number of pages is estimated at 700,085. The estimate of combined engagement between the (9506^{th}) page to the (700085^{th}) page is 1,010,028,510, and the top 9,505 pages, which we have full coverage of, would account for more than 91.26% of the total engagement for all 700,085 pages. If we assume the least popular page had more than 10 interactions, then the total number of pages is estimated at 378,012 and the top 9,505 pages would account for more than 91.27% of total engagement. If we assume the least popular page had more than 20 interactions, then the total number of pages is estimated at 309,598 and the top 9,505 pages would account for more than 91.28% of total engagement.
By the same logic, our English language shortlist, which includes every English language page from the 9,505 pages, should represent more than 91% of all engagement generated by all English language pages that mentioned one of the eight US politicians on the entire Facebook platform between January and February 2021.
Data collection
We built a Python-based parser to call the CrowdTangle API and ran it daily at 9:00 pm Eastern Time to collect the Facebook feeds for the last 24 hours, which contain image posts, status posts, link posts, and video posts. Then we constructed our co-sharing network using link posts from the last 24 hours on a daily basis. In the co-sharing network, nodes represent Facebook pages, and an edge exists between two nodes if they share at least one identical link. From January 20 to April 29, we collected 18,378,087 posts in total, including 11,248,706 (61.2%) link posts. Within that, 9,011,581 unique URLs were shared by the 16,169 pages.
Validation
To validate that the models were performing as expected, we manually coded all pairs of pages whose average inter-arrival time and/or the number of shared identical URLs were at the thresholds specified by our models, looking for evidence of formal coordination relationships such as co-management of overlapping personnel. Manual validation was completed by a co-author who holds a PhD in communication and has published extensively on the subject of news media and social media in the US. The results of manual validation are available in the data repository in Harvard Dataverse.
For repetitive sharing, we examined all 407 page pairs that shared 9 URLs and were still active at the time of writing this paper. Of these 407 pairs, 45 percent had strong evidence of co-management or common ownership or administrators. Sharing between other pairs seemed to come from ideologically similar pages (44 pairs), smaller news sites repeatedly posting stories from larger outlets (22 pairs), political organizations sharing favorable news stories (32 pairs), or pairs of pages that shared a common interest with no verified common staff (18 pairs).
For fast sharing, we coded all the 89 pairs of pages that on average shared identical links between 20 and 27 seconds. Of 89 page pairs, 87 percent had strong evidence of co-management or common ownership/administrators. For fast and repetitive sharing, we coded all 42 pairs of pages that shared a total of 9 URLs with an average inter-arrival time between 0 and 27 seconds. We found that 93 percent had strong evidence of co-management or common ownership/administrators. Interested readers can access these files in our Harvard Dataverse data depository.
Data availability
All data needed to evaluate the conclusions in the paper are present in Harvard Dataverse at https://doi.org/10.7910/DVN/XV2BLT.
References
-
Alizadeh, M., Shapiro, J. N., Buntain, C. & Tucker, J. A. Content-based features predict social media influence operations. Science advances 6, eabb5824 (2020).
-
Sharma, K., Zhang, Y., Ferrara, E. & Liu, Y. Identifying Coordinated Accounts on Social Media through Hidden Influence and Group Behaviours. Proceedings of the 27th ACM SIGKDD Conference on Knowledge Discovery & Data Mining (2020).
-
Sara, F. Facebook removes inauthentic campaign linked to Turning Point USA. https://www.axios.com/facebook-turning-point-usa-campaign-c2276486-5b24-4b4d-b78f-e62174863d1f.html (2020). [Online; accessed 20-September-2022].
-
Meta. July 2021 Coordinated Inauthentic Behavior Report. https://about.fb.com/news/2021/08/july-2021-coordinated-inauthentic-behavior-report/ (2021). [Online; accessed 20-August-2022].
-
Legum, J. Facebook allows prominent right-wing website to break the rules. Popular Information. https://popular.info/p/facebook-allows-prominent-right-wing (2019).
-
Confessore, N. & Bank, J. In the Trump Era, a Family’s Fight With Google and Facebook Over Disinformation (2019).
-
Assessing Russian Activities and Intentions in Recent US Elections. https://www.intelligence.senate.gov/sites/default/files/documents/ICA_2017_01.pdf (2017). [Online; accessed 30-September-2022].
-
Badawy, A., Ferrara, E. & Lerman, K. Analyzing the digital traces of political manipulation: The 2016 Russian interference Twitter campaign. In 2018 IEEE/ACM international conference on advances in social networks analysis and mining (ASONAM), 258–265 (IEEE, 2018).
-
Badawy, A., Addawood, A., Lerman, K. & Ferrara, E. Characterizing the 2016 Russian IRA influence campaign. Social Network Analysis and Mining 9, 1–11 (2019).
-
Hindman, M. & Barash, V. Disinformation,’fake news’ and influence campaigns on Twitter. Knight Foundation (2018).
-
Hindman, M. & Barash, V. How much “fake news” can we identify on Twitter? https://knightfoundation.org/features/misinfo/ (2018). [Online; accessed 21-October-2022].
-
Pacheco, D. et al. Uncovering coordinated networks on social media: Methods and case studies. arXiv preprint arXiv:2001.05658 (2020).
-
Weber, D. & Neumann, F. Amplifying influence through coordinated behaviour in social networks. Social Network Anlaysis and Mining (2021).
-
Ng, L. H. X. & Carley, K. M. Online coordination: methods and comparative case studies of coordinated groups across four events in the united states. In Proceedings of the 14th ACM Web Science Conference 2022, 12–21 (2022).
-
Nizzoli, L., Tardelli, S., Cresci, S. & Tesconi, M. Coordinated Behavior on Social Media in 2019 UK General Election. 15th International AAAI Conference on Web and Social Media (2020).
-
Luceri, L., Pantè, V., Burghardt, K. & Ferrara, E. Unmasking the web of deceit: Uncovering coordinated activity to expose information operations on twitter. In Proceedings of the ACM on Web Conference 2024, 2530–2541 (2024).
-
Tardelli, S. et al. Temporal dynamics of coordinated online behavior: Stability, archetypes, and influence. Proceedings of the National Academy of Sciences 121, e2307038121 (2024).
-
Ayers, J. W. et al. Spread of misinformation about face masks and COVID-19 by automated software on Facebook. JAMA internal Medicine 181, 1251–1253 (2021).
-
Okada, M., Yamanishi, K. & Masuda, N. Long-tailed distributions of inter-event times as mixtures of exponential distributions. Royal Society open science 7, 191643 (2020).
-
Broniatowski, D. A., Gu, J., Jamison, A., Simons, J. & Abroms, L. Facebook’s architecture undermines vaccine misinformation removal efforts (2022).
-
Giglietto, F., Righetti, N., Rossi, L. & Marino, G. It takes a village to manipulate the media: coordinated link sharing behavior during 2018 and 2019 Italian elections. Information, Communication & Society 23, 867–891 (2020).
-
Kim, Y. M. et al. The stealth media? Groups and targets behind divisive issue campaigns on Facebook. Political Communication 35, 515–541 (2018).
-
Broniatowski, D. A. et al. The covid-19 social media infodemic reflects uncertainty and state-sponsored propaganda. arXiv preprint arXiv:2007.096823 (2020).
-
Cinelli, M. et al. The COVID-19 social media infodemic. Scientific reports 10, 1–10 (2020).
-
Bradshaw, S., Howard, P. N., Kollanyi, B. & Neudert, L.-M. Sourcing and automation of political news and information over social media in the United States, 2016–2018. Political Communication 37, 173–193 (2020).
-
Guess, A., Aslett, K., Tucker, J., Bonneau, R. & Nagler, J. Cracking open the news feed: Exploring what us facebook users see and share with large-scale platform data. Journal of Quantitative Description: Digital Media 1 (2021).
-
Fresko, B. & Stephens, A. The Brothers Behind an Extreme Gun-Rights Network That Republicans Call a Big Scam. The Daily Beast (2020).
-
Yang, Y., Davis, T. & Hindman, M. Visual misinformation on facebook. Journal of Communication 73, 316–328 (2023).
-
Jaursch, J. & Ohme, J. & Klinger, U (Enabling Research with Publicly Accessible Platform Data, 2024).
-
Lukito, J. et al. The State of Digital Media Data Research, 2023. UT Faculty/Researcher Works (2023).
-
Castillo, C., El-Haddad, M., Pfeffer, J. & Stempeck, M. Characterizing the life cycle of online news stories using social media reactions. In Proceedings of the 17th ACM conference on Computer supported cooperative work & social computing, 211–223 (2014).
-
Asur, S., Huberman, B. A., Szabo, G. & Wang, C. Trends in social media: Persistence and decay. In Proceedings of the International AAAI Conference on Web and Social Media 5, 434–437 (2011).
-
Clauset, A., Shalizi, C. R. & Newman, M. E. Power-law distributions in empirical data. SIAM review 51, 661–703 (2009).
Funding
This research was funded by John S. and James L. Knight Foundation.
Author information
Authors and Affiliations
Contributions
Y.Y. and R.P. are the lead authors who designed the research, obtained funding, performed the research, analyzed the data, and wrote the paper. J.M. collected the data and contributed to data analysis. M.H., D.B., and H.H.H. supervised research design, data collection, and data analysis. All authors reviewed the manuscript.
Corresponding author
Ethics declarations
Competing interests
The authors declare no competing interests.
Ethical considerations
Our study used publicly available data accessed through CrowdTangle, a public insights tool owned and operated, and later canceled by Meta. We did not collect any private user data or personally identifiable information. The data analyzed in this study consists solely of public posts made by Facebook pages, not individual users. The George Washington University’s Office of Human Research determined that this study does not require submission to its Institutional Review Board.
Additional information
Publisher’s note
Springer Nature remains neutral with regard to jurisdictional claims in published maps and institutional affiliations.
Supplementary Information
Rights and permissions
Open Access This article is licensed under a Creative Commons Attribution-NonCommercial-NoDerivatives 4.0 International License, which permits any non-commercial use, sharing, distribution and reproduction in any medium or format, as long as you give appropriate credit to the original author(s) and the source, provide a link to the Creative Commons licence, and indicate if you modified the licensed material. You do not have permission under this licence to share adapted material derived from this article or parts of it. The images or other third party material in this article are included in the article’s Creative Commons licence, unless indicated otherwise in a credit line to the material. If material is not included in the article’s Creative Commons licence and your intended use is not permitted by statutory regulation or exceeds the permitted use, you will need to obtain permission directly from the copyright holder. To view a copy of this licence, visit http://creativecommons.org/licenses/by-nc-nd/4.0/.
About this article

Cite this article
Yang, Y., Paudel, R., McShan, J. et al. Coordinated link sharing on Facebook.
Sci Rep 15, 15684 (2025). https://doi.org/10.1038/s41598-025-00233-w
-
Received:
-
Accepted:
-
Published:
-
DOI: https://doi.org/10.1038/s41598-025-00233-w
Keywords
This post was originally published on this site be sure to check out more of their content