


Abstract
In early 2021, groups of Reddit and Twitter users collaborated to raise the price of GameStop stock from $20 to $400 in a matter of days. The heavy influence of social media activity on the rise of GameStop prices can be contrasted with the muted social media influence on other, more traditional stocks. While traditional stocks are modeled quite successfully by current methods, such methods break down when used to model these so-called meme stocks. Our project analyzes the graph topology of retweet graphs built from GameStop-related tweets and other meme stocks to find that the clustering coefficient and network diameter of a retweet graph can be used to decrease the mean absolute error of meme stock trading volume predictions by as much as 46% over the control group during the first 70 trading days of 2021.
Introduction
On January 13, 2021, the financial world was shocked by a strong display of an online movement sparking offline action. On that day, share prices of the video game retailer GameStop rose nearly 60%, and trading volume in the company exploded to 150 million shares. Over the next month, the price would rise from $20 to $400 while trading volume would remain around 100 million shares per day. Specifically, the move was caused by the unified effort of Reddit and Twitter users trying to trigger a short squeeze in the stock. The GME short squeeze came to be known as the first of several meme stock rallies and was a lucrative display of the power of social networks to affect behavior in the real world. A stock is considered a meme stock if it is both popular among traders on social media, and if it is bought and held with the intention of triggering a short squeeze.
The online movement began when stock analyst Keith Gill posted a screenshot of his approximately $50,000 investment in GameStop (ticker symbol GME) to the WallStreetBets subreddit on September 8, 20191. For several subsequent months, Gill would post monthly updates of his position to a middling reception on WallStreetBets. These posts would not start gaining traction until after Gill posted a YouTube video, presenting a fundamental and technical value analysis of GameStop2, suggesting that GME stock was undervalued for several reasons, including the potential upside of the company’s fundamentals. One of the other points in the video, that inspired a full follow-up, demonstrated the excessively high short interest in GME3. This idea that hedge funds and other institutional traders were profiting off the bankruptcy of an iconic video game retailer resonated with the young retail investors on YouTube and WallStreetBets4.
Gill’s subsequent posts rose in popularity as a narrative began to form around the idea of executing a collective short squeeze on GME stock. WallStreetBets posts emerged that outlined the mechanism of a short squeeze, where users would buy as much GME stock as possible and hold until hedge funds were forced to cover their short position at an elevated price5,6. Talk of the short squeeze spread outside of Reddit and took hold in the financial community on Twitter as well. Using the power of collective action facilitated by social networks, droves of retail traders bought GME shares, forcing hedge funds to lose billions of dollars closing their short positions7.
Yet, surprisingly little is known about such meme stock short squeezes. Considering the GameStop short squeeze as the first example of an entirely new phenomenon, meme stock literature has grown in the months following the event. Work in applied finance has presented the hypothesis that the GameStop short squeeze was motivated by intense desire to punish large institutions for their risky investments4,8. Hypotheses pointed to stored-up resentment from the 2008 market crash and to general resentment toward large institutional investors. These generally young and new investors flocked to the chance to stick it to the man while profiting themselves. The existence of strong emotions pointed toward a measurable change in the structure of the social networks9. Users that are unified by a common emotion tend to connect more frequently in Twitter hashtags and communities, potentially leaving an imprint on retweet networks. Indeed, research has shown that fearful sentiment on the WallStreetBets subreddit could be used to predict the price of GME stock10.
However, the emerging works are not limited to characterizing the motivations of meme stock traders. The goal of the meme stock literature is to integrate the mechanisms of the meme stock rallies into the broader study of computational finance, as an example of the effects of social media on financial markets. Multiple studies have used the 2021 meme stock rallies to create “alert systems” that detect when retail trading of a stock becomes sufficiently unified that it can exert pressure on the market11,12. One notable study presented a DeGroot model of financial markets where some users received market information from social media13. This simulation model asserts that unified social media users have a market effect comparable to that of rational agents. These new studies, motivated by the meme stock rallies, form the foundation of works updating computational finance with the new information provided by these rallies.
In general, previous efforts in computational finance and social media analysis have yielded mixed results in predicting market movements that are driven by online chatter14,15. In a review of 124 deep learning works in the field of stock market prediction, Jiang shows that a large majority of models use market fundamentals and text as their data sources16. However, these approaches are much weaker for predicting meme stock activity. The meme stock rallies involve traders buying stock in spite of the company’s fundamental performance, rendering the most commonly-used data source useless17. Additionally, most text data was used to train sentiment analysis models, which ignore network structure to instead focus on attitudes10,18. Zhang et al. asserted that overall sentiment on Twitter was correlated with a stock’s intraday movement19. Filtering tweets specific to the company was unnecessary, as a general negative sentiment across Twitter would likely predict falling stocks. However, these findings have been weakened by the passage of time. Since 2011, Twitter has grown significantly with hundreds of millions of tweets being posted on a daily basis20, rendering the determination of general sentiment on Twitter nearly impossible21.
Among the many computational works that use sentiment analysis of social media data, another set of studies is using social media data in new ways to broaden understanding of their impact on financial markets. Oliveira et al. found limited correlations between Twitter posts and the price of individual stocks but noted that Twitter posting volume is correlated with trading volume on a given day22. The volume of trades during the GameStop short squeeze was significantly higher than on previous days, indicating that Twitter activity may have driven the observed increase in meme stock trade volume. This interpretation is further strengthened by the results of Jiao et al., showing that social media coverage has a unique effect on the markets for individual stocks23. Specifically, Jiao et al. defined a metric for social media buzz as input for an auto-regressive model that predicts the price volatility of a certain stock. Increased social media buzz is considered an antecedent for an information environment lacking consensus and thus prone to more dramatic price moves. This finding supports the hypothesis that the influence of social networks on the trade volume of meme stock may be significant. The meme stock phenomenon is adjacent to the computational finance literature describing event-based effects on markets. Previous works have shown that company relevant events, represented by 8-K filings, create a surge in company-specific social media posts that have effects on the trading volume of that company. These effects have been verified in both sentiment-based and topology-based experiments using text and network data24,25,26. However, the meme stock rallies prove to be an interesting context to study whether these event-based effects can occur event when the ‘event’ is the social media activity itself.
Here, we investigate the GameStop short squeeze of early 2021 to illuminate the role social media activity played in motivating stock trading. We frame the trading volume of meme stocks and traditional, non-meme stocks as a function of the topology of the retweet networks built from Twitter discussion of those stocks. Instead of focusing on sentiment variables or economic indicators, our study advances knowledge in computational finance by integrating a lesser used data source, namely the graph topology of online social networks, into classical methods of predicting stock movement. Through regression and Granger causality models, we find that the trading volume of traditional stocks is mostly dependent on the volume of the previous day. However, we observe that the trading volume of meme stocks is significantly dependent on a dense network structure in the underlying stock-specific Twitter networks. According to Romero et al., when subjected to an external shock, a social network will tend to become denser as individual nodes increase their clustering coefficients in an attempt to improve decision making9. Our results suggest that dense communication between traders through retweets are predictive of the trading dynamics of certain meme stocks during the early months of 2021.
Results
To robustly compare the network topologies between traditional stocks and meme stocks, we first must specifically define meme stock as a selection criterion. In the literature, the universe of meme stocks is typically defined in terms of the list of stocks that faced trading restrictions by brokers in early 202127,28,29. However, despite many works noting that meme stocks were targeted due to excessively high short interest, no other works fine tune their definition by integrating short interest data. Additionally, we limit our data to include only stocks that are highly mentioned on the WallStreetBets subreddit since most literature agrees that WallStreetBets is the origin of the meme stock phenomenon7,30. We therefore consider a stock to be a meme stock if, during the month of January 2021, it was one of the most mentioned stocks on WallStreetBets, had its trading restricted on the Robinhood app, and had a short interest above 20%. Using such criteria, we selected GameStop Corp. (GME), AMC Entertainment (AMC), Blackberry Limited (BB), and Palantir Technologies (PLTR). As a control group, we selected four additional companies, which were also among the most mentioned on WallStreetBets but maintained a short interest below 20%. This traditional stock group included Apple Inc (AAPL), Advanced Micro Devices (AMD), Microsoft (MSFT), and Nvidia (NVDA).
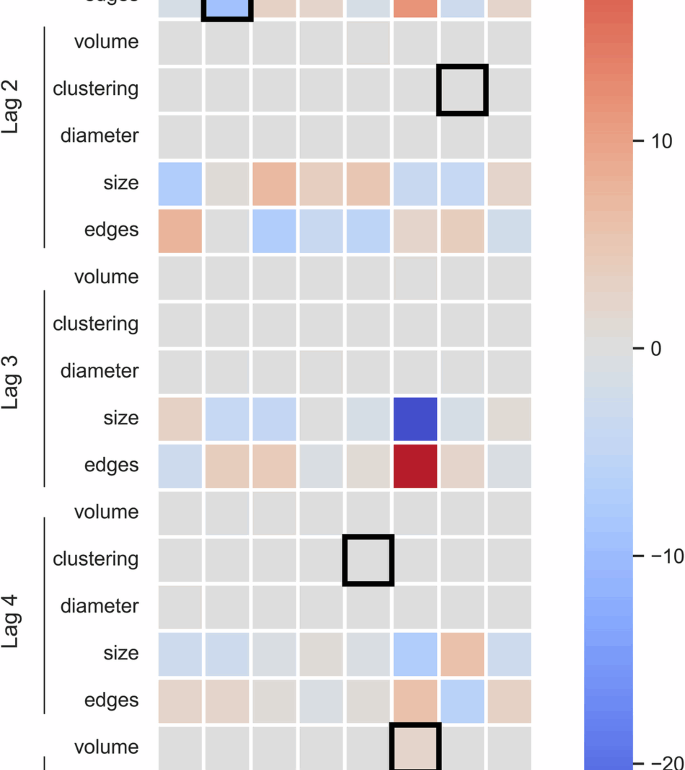
Traditional stocks (AAPL, AMD, MSFT, NVDA) have robust trading markets, prompting us to expect that the daily trading volume was largely resistant to changes in the topology of retweet networks. To test this hypothesis, we applied an auto-regression model that captured the trading volumes as well as topological parameters of the day- and stock-specific retweet networks using multiple lag times. In the heatmap in Fig. 1, we observed that for our set of traditional stocks, volume of the previous trading day was most significant for the prediction of the current trading day. Additionally, of the lag lengths tested on our traditional stocks, the optimal length for our auto-regressive models was l = 1.

We observed that trading volume on the previous day was most predictive of trading volume on a given day for traditional stocks. However, we found that the trading volume of meme stocks on a given day is more dependent on topological metrics from retweet networks over the preceding five days. Statistically significant features (p < 0.05) are highlighted in black and included as terms in the final regression equations.
In turn, the set of meme stocks (AMC, BB, GME, PLTR) had smaller trading markets, prompting us to hypothesize that their trading volumes were less resistant to changes in the topology of retweet networks. Indeed, in Fig. 1, we observed that meme stocks showed significant dependencies on topological characteristics in lagging trading days. Unlike traditional stocks, that all had an optimal lag length of one day, the prediction of the trading volumes of meme stock on a given day t had optimal lag times of l >1. AMC and PLTR have an optimal lag length of 4, while GME and BB have an optimal lag length of 5. Furthermore, we found that the AIC of three out of the four meme stocks (AMC, GME, and BB) are lower than the full set of traditional stocks’ AICs, corresponding to better models of the target variable. Since the meme stock models have more information in their variables, as measured by AIC, model selection supports our initial hypothesis that network topology could be used to better model meme stock trading volume.
Based on the significant independent variables on the p < 0.05 level, we build Vector Auto-regression equations using the optimal lag lengths for each company. For the group of traditional stocks, we found simple regression equations that largely summed the lag-1 volume term and a constant term. Only AMD had any significant variable other than lag-1 trading volume. Even then, the other significant variables worked out to equal a small ratio of the difference between the number of nodes and the number of edges for the previous day. This finding is likely due to correlation between the number of nodes and number of edges in the graph. However, this correlation only affects AMD as this is the only stock to have the number of nodes or edges as a significant predictor. From such observations, we can gather that, for any potential lag length, no improvements can be made on the prediction accuracy of traditional stocks by including network connectivity variables. In these datasets, trading volume is best represented as an autoregressive time series with lag length 1.
Although meme stocks have as many as five days of data to include in their regression equations, three of the models returned equations with two terms and the fourth returned an equation with three terms. This is equivalent to the size of the traditional stock equations, alleviating worries of over-fitting by using more terms in the regression equation. Two of the meme stocks (AMC and GME) have significant variables from the days immediately preceding the data (lag 1 or lag 2) and from days further out in the past (lag 4 or lag 5). The other two either have only short-term variables (PLTR) or only long-term variables (BB), the first instance where we noted the divergence of AMC and GME with respect to the other meme stocks.
Forecasting
We use the regression equations learned through the Vector Auto-regression procedure in the previous section, with only the statistically significant terms included, to forecast the trading volume values for each stock throughout our 70 day dataset. Since auto-regressive equations need data from multiple previous days, our forecasting begins at t = l +1 for each stock. Since the traditional stocks all had a maximum lag length of 1, we generate trading volume values for days 2 through 70 in the datasets for each stock. For each of the traditional stocks, the ground truth trading volume and predicted trading volume are plotted in Fig. 2, as well as the difference between the two values on each day. Because the primary variance in each regression equation is provided by the previous day’s trading volume, the predicted values tend to be a right-shifted transformation of the ground truth values. We observed that the prediction of the trading volume is mediocre with a mean mean absolute error (MAE) of 0.1269. Though the MAE is not excessively high, the lack of variables other than lag-1 trading volume lead to predictions that are not particularly insightful.

Each subfigure plots the results for one of the four traditional stocks in our dataset: A AAPL, B AMD, C MSFT, D NVDA. The bottom panels plot the ground truth trading volume in green and the predicted volume in orange, while the top panels show the difference between these two values each day.
Similarly, using the set of learned regression equations, we generate trading volume values for days 5 (or 6) through 70 in the datasets for each of our meme stocks. For each of the stocks, the ground truth trading volume, predicted trading volume, and difference between these values are plotted in Fig. 3. Notably, the integration of retweet network topology allows the model to better predict when volume moves will occur with an average MAE of 0.0679, a vast improvement over the prediction of trading volume for the traditional stocks. Additionally, the topological variables allow the predictions to be more insightful; in several cases, the autoregression models peak at the exact timestep where the ground truth data peaks as well.

Each subfigure plots the results for one of the four meme stocks in our dataset: A AMC, B BB, C GME, D PLTR. The bottom panels plot the ground truth trading volume in green and the predicted volume in orange, while the top panels show the difference between these two values each day.
To boost the robustness of our results, we repeat this forecasting procedure using a randomly selected test set of 15 days. After prediction, we find that the average MAE of the traditional stock group is 0.1526 and the MAE of the meme stock group is 0.1179. This represents a more modest, but still meaningful improvement of 22.74%. This more muted improvement is likely caused by the limited test set. The meme stock rallies occurred more prominently on certain specific days, and our test set may include days with varying importance to the rallies. However, even with this, the observed trend still remains intact.
Granger causality
As an additional measure of the correlations between our graph variables and the trading volume, we measured the Granger causality of each model’s variables to increase the robustness of our analysis. The Granger causality for each variable on each company’s trading volume can be seen in Table 1.
As Granger causality assumes, causes in this data must occur before the effects. Trading volume cannot be impacted by retweet graph topology without changes in retweet graphs occurring before subsequent moves in the trading volume. Granger causality is also not a measure of true causality, but instead measures the time-lagged correlation between two time series. It may be the case that a confounding variable such as media coverage, algorithmic trading parameters, or offline discussions can be an alternative causal mechanism. However, our analysis provides results that are insightful even without the assurance of true causality.
When measuring the Granger causality of each stock, we find a counter intuitive split. Rather than split between traditional and meme stocks like the lag length optimization, we find that AMC and GME form a group distinct from the other six stocks being measured. Only these two stocks have significant Granger causality from clustering coefficient onto trading volume. BB, PLTR, and three of the traditional stocks only have trading volume as a Granger causal variable. AMD has significant Granger causality from the number of nodes and number of edges, but as we saw in the regression equation for the stock, these likely cancel each other out.
We additionally tested for reserve causality among our variables. We find significant reverse causality from GME and AMC volume causing the number of nodes and edges. These variables are not significant features for either of the models (see Fig. 1), but still constitute a relevant finding. As trading increased, the network of users discussing the stocks increased in turn. The density of these networks then subsequently forecasts additional moves in the volume. Rather than simply corroborate the findings of our autoregressive modeling, the Granger causality tests point to a new grouping of stocks that may be insightful to examine as unique.
Discussion
Our choice to predict trading volume rather than price or price change is based in the literature of financial markets. The movement of stock prices is incredibly complex and difficult to predict, as a result of the numerous explanatory factors that vary over time in their explanatory importance31. These factors include company specific news such as earnings reports, macroeconomic news such as interest rate moves, or the psychological state of the investing community. Recent innovations in deep learning have only led to minor improvements in decoding the inherent complexity16. Considering that the meme stock phenomenon involves traders buying a company’s stock despite its fundamentals, this complexity is accentuated in our analysis. However, as seen in posts on WallStreetBets, many users considered the act of buying and holding GME stock as their target action5. Thus, predicting volume provides useful information without the need to rely on the inexact science of predicting stock prices32. Because of this complexity, we chose to measure the most direct indication of online traders’ effect on our set of stocks, their trading volume. Previous works have shown that trading volume, however, is highly persistent33. This trend is also true for our datasets, as we note trading volume having positive autocorrelation for the majority of examined stocks.
Even accounting for the persistence of trading volume, our experiment uncovers the tendency of the clustering coefficient to predict a user’s willingness to take action and buy GME or AMC stock. In Twitter terminology, the clustering coefficient of a graph quantifies what fraction of users who retweet the same user have retweeted each other. A higher fraction of edges between a user’s neighbors leads to a higher coefficient and represents a more dense and lively online discussion. Previously, it was shown that in the presence of an external shock, social networks have the tendency to become temporarily denser to reinforce their in-group9.
This topological shift combines with the psychological and social effects of smaller, denser social networks. In the domain of social media stock traders, such groups are more likely to share common stock purchasing motivations and their rhetoric can be more effective at framing the decision to buy a meme stock34,35. As a consequence, people are more likely to change their behavior if the change is endorsed by their in-group, and the local clustering coefficient can directly measure how strong a particular user’s in-group is. Averaging this clustering coefficient over the full graph is a sufficient method for our experiments, as isolating the core of the network from its periphery prior to calculating clustering coefficient does not improve the predictive power of the model. Leveraging this information allows our purely graph theoretic approach to yield better results on data from the GameStop short squeeze than other studies that use sentiment analysis as their primary source of information. Indeed, we attempted to add data corresponding to the emotional valence of each tweet, measuring the six Ekman emotions, but found no significant results among these variables36,37.
A second curiosity in our results is the split within the meme stock group, with BB and PLTR behaving more like traditional stocks than AMC and GME. Based on the content of WallStreetBets and Twitter posts, GME and AMC had the most support and group cohesion in executing their short squeezes. Many other stocks were proposed as short squeeze targets because of their high short interest, and the subsequent online discussion likely led to meeting our criteria for selection as a meme stock. However, traders likely did not have the mental bandwidth to focus on more than the two primary meme stocks. Additionally, media coverage providing hype to the meme stock movement was aggressive in trying to predict new potential meme stocks. Therefore, despite fitting our selection criteria, BB and PLTR did not have similar regression or Granger causality results compared to GME and AMC. As such, our contribution to the computational finance literature consists of demonstrating the explanatory power of graph topological metrics when measuring social media impact on stock trading volume. A second finding from our analysis shows that graph topology may also identify which heavily shorted stocks have the widespread support necessary to become true meme stocks, although further testing is needed to prove this hypothesis.
This paper offers a historical analysis of the social network variables on Twitter that play a role in predicting the movement of stocks during the meme stock rallies of early 2021. Future work in the area of computational finance should look to avoid the limitations of our study. The first limitation of this study is potential biases in data collection. Because we prioritized using publicly available data that can be used to construct network graphs, our data were collected entirely from Twitter. Although data from WallStreetBets were used to select the set of stock studied, the lack of data taken directly from Reddit posts can limit the completeness of our analyses. Future works may look to integrate Reddit data directly by either using Reddit sentiment as additional datapoints at each time step or by combining the networks of Reddit and Twitter users by scraping Twitter handles from Reddit profiles (or vice versa). Additionally, our searches were based on the Twitter’s Cashtag tagging system, which ideally limits results to posts from highly in-the-know users discussing a company in terms of its stock. This procedure misses out on relevant posts that do not use a Cashtag, which can also limit the completeness of our dataset.
The auto-regressive models demonstrated in this paper use four network topological metrics to predict trading volume. However, our exploratory analysis tested several network metrics, and only these four produced non-null results. The tested, and then excluded, null variables include: average degree, out-degree centrality, closeness centrality, graph transitivity, percentage of nodes in the k-core, and a measurement of the six Ekman emotions mentioned above (anger, disgust, fear, joy, sadness, surprise).
The data as collected are unable to shed light on such issues as monitoring or addressing market manipulation on social media. The United States Securities and Exchange Commission offers insight into how these trends we examine from a social network perspective affect the incentives and capital structure of markets7. Given the changes to data collection costs on Twitter/X, we cannot offer a more detailed analysis without undergoing costly data collection. We encourage future work from a primarily financial perspective to augment the meme stock discussion with analysis of market structure and manipulation concerns.
Our experiments analyzed one moment in time where social media played a large role in the movement of stock, the meme stock short squeeze of January through April 2021. We also used simpler models for time series forecasting such that our results are interpretable and our predictions can be easily attributed to individual variables. Our limited time frame is sufficient for our historical analysis but does limit the ability to generalize our results. Meme stock rallies continued to appear, though with less frequency, in subsequent years. Since 2021, the rhetoric of the meme stock rallies have been used to advertise increasingly risky investments such as meme coin crypto tokens38,39. These markets may not behave the same way as our data, but similar terminology may lead to any meme investments being likened to each other. Future works can look to integrate procedures to detect when social media buzz can affect a stock with procedures, based on our study, that predict movements in the stock based on this buzz. This can lead to eventually developing data-driven generalizable trading strategies using social media network data. These works that are focused on optimizing prediction performance should use newer deep learning techniques.
Using the aggregate MAE values for the traditional and meme stocks, we find that meme stock volume prediction error is reduced by 46.48% compared to the prediction error of traditional stock volume. For our out-of-sample predictions, the error reduction is a modest but still relevant 22.74%. We have also shown that the average clustering coefficient is a statistically significant indicator of trading volume for meme stocks. Though Granger causality can only be considered a measure of time-lagged correlation, instead of true causality, we show that moves in trading volume are preceded by moves in the average clustering coefficient of the retweet graphs.
Autoregressive modeling confirms our hypothesis that stock trading markets during the GameStop short squeeze of 2021 behave significantly differently from the markets of more traditional stocks and that information pertaining to this difference is latent within the retweet networks of online discussion of the stocks. Our observations indicate that the clustering coefficient of a social network graph is the most effective metric at quantifying this difference. The clustering coefficient measures the network’s density at the level of each user, being most effective at predicting when group cohesion would lead to increased trading activity.
Previous approaches to predicting stock market moves using social media data have been sentiment analysis-based approaches with clear weaknesses. The most impactful two of these weaknesses are their typically low-power predictions, usually creating a binary classifier to predict either upward or downward momentum, and their ignoring of the network structure implicit in using social media data. Our network topology-based approach can identify the latent information within the network structure of online discussion and apply it to improving prediction. In addition to identifying a subset of behaviorally unique meme stocks, namely GameStop and AMC Entertainment, we showed that these meme stocks had trading volume spikes approximately 2 and 5 days following a spike in retweet network density. These insights are useful for demonstrating how phenomena not based in market fundamentals, but rather in social networks, affect a stock.
Materials and methods
Data for this project was collected using the Academic Research API from Twitter, and queries were made to the Tweet Search v2 endpoint. Most Tweet Search queries are formed using a hashtag, Twitter’s searchable tags that allow users to tag their own posts and appear in a unified newsfeed. However, for stock market related discussion, Twitter has a distinct tagging system called a cashtag (stylized as $GME for GameStop). For each of the eight companies in our set of meme stocks and traditional stocks, we queried the Tweet Search API for all tweets containing their cashtag between January 1 and April 15, 2021. This timeframe corresponds to the first 70 trading days of 2021. The Tweet searches were carried out beginning on March 9, 2022 and ending on April 3, 2022.
These eight sets of tweets were then transformed into social network graphs for analysis. Each collection of tweets was parsed to isolate retweets, which are the foundation of the graphs to be built. A Twitter user may retweet a post from another user, therefore sharing it with their followers, as a method of amplifying the original poster’s content. Each collection of retweets was then used to assemble a graph of the full retweet network for discussion of a given company. In these graphs, users are modeled as nodes and retweets are modeled as directed edges, a procedure common to social media network literature40,41,42. Edges are oriented in the direction of information flow; if user i retweets content from user j, we place a directed edge from j to i. The final preprocessing step was dividing the full network graph into daily timesteps. The collection of retweets was filtered by unique date in the timestamp field, resulting in 70 unique subgraphs of each stock that represent each trading day in the dataset.
The target variable for our analyses was the daily trading volume of each stock that we parsed for all our stocks from the Yahoo Finance historical data page43.
Topological analysis of retweet networks
Previous work has shown that when exposed to an external shock, social networks have the tendency to temporarily become denser9. Nodes favor their strong ties and cut out weaker ties from their neighborhood, which leads to an uptick in the graph clustering coefficient. Based on these previously validated results, we measured several graph topological metrics that indicate when an information flow graph becomes denser. Our primary measure of network density is the clustering coefficient, which measures the fraction of all triads which are closed triangles for a network of size n and individual node u44. In particular, in each stock-specific daily retweet network we calculated the average clustering coefficient, defined as
where T(u) refers to all existing edges between the k neighbors of node u. Furthermore, we determined the network’s diameter as a measure of the maximum number of steps needed for a specific piece of information to propagate through that day’s entire network45,46 that we defined as
where σ(i, j) is the shortest path between nodes i and j. Additionally, the number of nodes and edges were included to calculate each day’s average degree.
Auto-regressive models
These metrics were organized into a time series dataframe to test which values can be used as predictors for trading volume on future days. For each stock, the data was normalized onto a [0,1] range to maintain a consistent scaling. When conducting statistical experiments on time series data, each time series must be shown to be stationary; otherwise, the assumptions of statistical tests fail and results are meaningless. Therefore, we used the Augmented Dickey-Fuller test from Eq. 3 to show that each variable in the dataframe was stationary (rejecting the null hypothesis that δ = 0 for arbitrary coefficients α and β) and required no transformations for time series experiments to be carried out.
Each model required an optimal lag length to ensure that there was no over-fitting from including more variables than are meaningful. Several lag lengths between l = 1 and l = 10 were tested, and their Akaike information criteria (AIC) were compared to select the order of the model best fit to each company’s data. Using the optimal lag length, a Vector Autoregression model was fit to the data to predict the dependent variable, trading volume (Vol), based on our set of independent variables, namely clustering coefficient (Clus), Diameter (Dia), number of nodes (N) and number of edges (E). This classical method of predicting stock trading volume was used to highlight the information gain from using network topological variables as predictors, rather than using new data and new prediction methodologies47,48. After fitting the regression model, the set of coefficients were examined to identify which lagged variables were significantly predictive of the trading volume.
After evaluating the significance of individual variables, each model was used to predict trading volumes for the entire 70-day time series, and the goodness of fit for the full model was tested by measuring the mean absolute error (MAE) of the predicted volume against the actual volume as in
Granger causality
To bolster our findings, we took the Granger causality of trading volume with respect to each of our independent variables. Granger causality measures whether one time series is globally predictive of another. In economic contexts, Granger causality of one time series on another is relevant as a measure of forecasting strength rather than of true causality49. There still may be alternative causal mechanisms present in the data. Granger causality measures the strength of a variable by taking a t-test at each possible lag value; all significant results are combined and used as the input to an F-test. If the F-test returns a p-value below 0.05 for an independent variable, that variable has temporal predictive power with respect to the dependent variable. Granger causality can be directly computed using the results of a Vector Autoregression model by considering the coefficient matrix A and the lag-length l, through
Data availability
The data to reproduce results of this article are publicly available at Zenodo (https://doi.org/10.5281/zenodo.11664235).
Code availability
The code used to build graphs and run experiments are publicly available at Zenodo (https://doi.org/10.5281/zenodo.11664235).
References
-
Gill, K. Hey burry thanks a lot for jacking up my cost basis. https://www.reddit.com/r/wallstreetbets/comments/d1g7x0/hey_burry_thanks_a_lot_for_jacking_up_my_cost/ (2019). [Accessed: 2023-09-09].
-
Gill, K. 100%+ short interest in GameStop stock (GME) – fundamental & technical deep value analysis. https://www.youtube.com/watch?v=GZTr1-Gp74U (2020). [Accessed: 2023-09-09].
-
Gill, K. The Big Short SQUEEZE from $5 to $50? Could GameStop stock (GME) explode higher?? Value investing! https://www.youtube.com/watch?v=alntJzg0Um4 (2020). [Accessed: 2023-09-09].
-
Hasso, T., Müller, D., Pelster, M. & Warkulat, S. Who participated in the GameStop frenzy? Evidence from brokerage accounts. Financ. Res. Lett. 45, 102140 (2022).
-
WallStreetBets. This is why you should HOLD Shares and BUY more GME regardless of current price or volatility. https://www.reddit.com/r/wallstreetbets/comments/l76f74/this_is_why_you_should_hold_shares_and_buy_more/ (2021). [Accessed: 2023-09-09].
-
Anand, A. & Pathak, J. The role of Reddit in the GameStop short squeeze. Econ. Lett. 211, 110249 (2022).
-
US Securities and Exchange Commission. Staff report on equity and options market structure conditions in early 2021. https://www.sec.gov/files/staff-report-equity-options-market-struction-conditions-early-2021.pdf (2021). [Accessed: 2023-09-09].
-
Chohan, U. W. Counter-hegemonic finance: The GameStop short squeeze. Chohan, U. W. & van Kerckhoven, S. (eds.) Activist Retail Investors and the Future of Financial Markets, chap. 13 (Taylor & Francis, 2023).
-
Romero, D. M., Uzzi, B. & Kleinberg, J. Social networks under stress. Proceedings of the 25th International Conference on World Wide Web, 9–20 (2016).
-
Long, S., Lucey, B., Xie, Y. & Yarovaya, L. “I just like the stock”: The role of Reddit sentiment in the GameStop share rally. Financial Rev. 58, 19–37 (2023).
-
Costola, M., Iacopini, M. & Santagiustina, C. R. On the “mementum” of meme stocks. Econ. Lett. 207, 110021 (2021).
-
Gianstefani, I., Longo, L. & Riccaboni, M. The Echo Chamber Effect Resounds on Financial Markets: A Social Media Alert System for Meme Stocks. Available at SSRN: https://doi.org/10.2139/ssrn.4053771 (2022).
-
Pedersen, L. H. Game on: Social networks and markets. J. Financial Econ. 146, 1097–1119 (2022).
-
Sul, H. K., Dennis, A. R. & Yuan, L. Trading on Twitter: Using social media sentiment to predict stock returns. Decis. Sci. 48, 454–488 (2017).
-
Piñeiro-Chousa, J., Vizcaíno-González, M. & Pérez-Pico, A. M. Influence of social media over the stock market. Psychol. Mark. 34, 101–108 (2017).
-
Jiang, W. Applications of deep learning in stock market prediction: Recent progress. Expert Syst. Appl. 184, 115537 (2021).
-
Umar, Z., Gubareva, M., Yousaf, I. & Ali, S. A tale of company fundamentals vs sentiment driven pricing: The case of GameStop. J. Behav. Exp. Financ. 30, 100501 (2021).
-
Htun, H. H., Biehl, M. & Petkov, N. Survey of feature selection and extraction techniques for stock market prediction. Financial Innov. 9, 26 (2023).
-
Zhang, X., Fuehres, H. & Gloor, P. A. Predicting stock market indicators through Twitter “I hope it is not as bad as I fear”. Procedia-Soc. Behav. Sci. 26, 55–62 (2011).
-
InternetLiveStats. Twitter Usage Statistics – Internet Live Stats. https://www.internetlivestats.com/twitter-statistics/ (2023). [Accessed 2023-09-09].
-
Haq, E.-U. et al. Short, colorful, and irreverent! A comparative analysis of new users on WallStreetBets during the GameStop short-squeeze. Companion Proceedings of the Web Conference 2022, 52–61 (2022).
-
Oliveira, N., Cortez, P. & Areal, N. The impact of microblogging data for stock market prediction: Using Twitter to predict returns, volatility, trading volume and survey sentiment indices. Expert Syst. Appl. 73, 125–144 (2017).
-
Jiao, P., Veiga, A. & Walther, A. Social media, news media and the stock market. J. Econ Behav. Organ. 176, 63–90 (2020).
-
Debreceny, R. S., Rahman, A. & Wang, T. Is user-generated Twittersphere activity associated with stock market reactions to 8-K filings? J. Inf. Syst. 35, 195–217 (2021).
-
Hirshleifer, D., Peng, L. & Wang, Q. News diffusion in social networks and stock market reactions. Rev. Financ. Stud. 38, 883–937 (2025).
-
Rahman, A. & Debreceny, R. 8-K filings, Twitter activities and stock market reactions. American Accounting Association Annual Meeting Program (American Accounting Association (AAA), 2015).
-
Allen, F., Haas, M., Nowak, E., Pirovano, M. & Tengulov, A. Squeezing shorts through social media platforms.Swiss Finance Institute Research Paper 21 (2021).
-
Aloosh, A., Choi, H.-E. & Ouzan, S. Meme stocks and herd behavior. Available at SSRN 3909945 (2021).
-
Lyócsa, Š., Baumöhl, E. & Vy`rost, T. YOLO trading: Riding with the herd during the GameStop episode. Financ. Res. Lett. 46, 102359 (2022).
-
Alvarez, R., Bhatt, P., Zhao, X. & Rios, A. Turning stocks into memes: A dataset for understanding how social communities can drive Wall Street. Proc. Int. AAAI Conf. Web Soc. Media 16, 1192–1200 (2022).
-
Cutler, D. M., Poterba, J. M. & Summers, L. H. What moves stock prices? Bernstein, P. L. & Fabozzi, F. J. (eds.) Streetwise, chap. 8, 56–64 (National Bureau of Economic Research Cambridge, Mass., USA, 1988).
-
Blume, L., Easley, D. & O’hara, M. Market statistics and technical analysis: The role of volume. J. Financ. 49, 153–181 (1994).
-
Covrig, V. & Ng, L. Volume autocorrelation, information, and investor trading. J. Bank. Financ. 28, 2155–2174 (2004).
-
Cinelli, M., De Francisci Morales, G., Galeazzi, A., Quattrociocchi, W. & Starnini, M. The echo chamber effect on social media. Proc. Natl. Acad. Sci. 118, e2023301118 (2021).
-
Chang, D., Chen, R. & Krupka, E. Rhetoric matters: A social norms explanation for the anomaly of framing. Games EconBehav. 116, 158–178 (2019).
-
Zad, S., Heidari, M., James H. Jr. & Uzuner, O. Emotion detection of textual data: An interdisciplinary survey. 2021 IEEE World AI IoT Congress (AIIoT), 0255–0261 (IEEE, 2021).
-
Tracy, J. L. & Randles, D. Four models of basic emotions: A review of Ekman and Cordaro, Izard, Levenson, and Panksepp and Watt. Emot. Rev. 3, 397–405 (2011).
-
Krause, D. Beyond the hype: A meme coin reality check for retail investors. Available at SSRN 4891841 (2024).
-
Yogarajah, Y. ‘Hodling’ on: Memetic storytelling and digital folklore within a cryptocurrency world. Econ. Soc. 51, 467–488 (2022).
-
Cherepnalkoski, D. & Mozetic, I. A retweet network analysis of the European Parliament. 2015 11th International Conference On Signal-Image Technology & Internet-Based Systems (SITIS), 350–357 (IEEE, 2015).
-
Evkoski, B., Mozetič, I., Ljubešić, N. & Kralj Novak, P. Community evolution in retweet networks. PLOS ONE 16, 1–21 (2021).
-
Stewart, L. G., Arif, A. & Starbird, K. Examining trolls and polarization with a retweet network. Proc. ACM WSDM, Workshop on Misinformation and Misbehavior Mining on the Web, 70 (2018).
-
YahooFinance. Gamestop Corp. stock historical prices and data. https://finance.yahoo.com/quote/GME/history/ (2021). [Accessed: 2022-09-19].
-
Myers, S. A., Sharma, A., Gupta, P. & Lin, J. Information network or social network? the structure of the Twitter follow graph. Proceedings of the 23rd International Conference on World Wide Web, 493–498 (2014).
-
Goldberg, A. V. & Harrelson, C. Computing the shortest path: A* search meets graph theory. Proceedings of the Sixteenth Annual ACM-SIAM Symposium on Discrete Algorithms, 156–165 (2005).
-
Takes, F. W. & Kosters, W. A. Determining the diameter of small world networks. Proceedings of the 20th ACM International Conference on Information and Knowledge Management, 1191–1196 (2011).
-
Ranco, G., Aleksovski, D., Caldarelli, G., Grčar, M. & Mozetič, I. The effects of Twitter sentiment on stock price returns. PLOS ONE 10, 1–21 (2015).
-
Zhao, S., Tong, Y., Liu, X. & Tan, S. Correlating Twitter with the stock market through non-Gaussian SVAR. 2016 Eighth International Conference on Advanced Computational Intelligence (ICACI), 257–264 (IEEE, 2016).
-
Shojaie, A. & Fox, E. B. Granger causality: A review and recent advances. Annu. Rev. Stat. Application 9, 289–319 (2022).
Acknowledgements
The authors thank the anonymous reviewers for their valuable suggestions.
Author information
Authors and Affiliations
Contributions
D.V. and S.W. conceived the experiment(s), D.V. collected the data, D.V. analysed the results. D.V., N.J., and S.W. wrote and reviewed the manuscript.
Corresponding author
Ethics declarations
Competing interests
The authors declare no competing interests.
Additional information
Publisher’s note Springer Nature remains neutral with regard to jurisdictional claims in published maps and institutional affiliations.
Rights and permissions
Open Access This article is licensed under a Creative Commons Attribution-NonCommercial-NoDerivatives 4.0 International License, which permits any non-commercial use, sharing, distribution and reproduction in any medium or format, as long as you give appropriate credit to the original author(s) and the source, provide a link to the Creative Commons licence, and indicate if you modified the licensed material. You do not have permission under this licence to share adapted material derived from this article or parts of it. The images or other third party material in this article are included in the article’s Creative Commons licence, unless indicated otherwise in a credit line to the material. If material is not included in the article’s Creative Commons licence and your intended use is not permitted by statutory regulation or exceeds the permitted use, you will need to obtain permission directly from the copyright holder. To view a copy of this licence, visit http://creativecommons.org/licenses/by-nc-nd/4.0/.
About this article

Cite this article
Verdear, D., Johnson, N.F. & Wuchty, S. Influence of Twitter social network graph topologies on traditional and meme stocks during the 2021 GameStop short squeeze.
npj Complex 2, 18 (2025). https://doi.org/10.1038/s44260-025-00042-2
-
Received:
-
Accepted:
-
Published:
-
DOI: https://doi.org/10.1038/s44260-025-00042-2
This post was originally published on this site be sure to check out more of their content