Abstract
Understanding how misinformation affects the spread of disease is crucial for public health, especially given recent research indicating that misinformation can increase vaccine hesitancy and discourage vaccine uptake. However, it is difficult to investigate the interaction between misinformation and epidemic outcomes due to the dearth of data-informed holistic epidemic models. Here, we employ an epidemic model that incorporates a large, mobility-informed physical contact network as well as the distribution of misinformed individuals across counties derived from social media data. The model allows us to simulate various scenarios to understand how epidemic spreading can be affected by misinformation spreading through one particular social media platform. Using this model, we compare a worst-case scenario, in which individuals become misinformed after a single exposure to low-credibility content, to a best-case scenario where the population is highly resilient to misinformation. We estimate the additional portion of the U.S. population that would become infected over the course of the COVID-19 epidemic in the worst-case scenario. This work can provide policymakers with insights about the potential harms of exposure to online vaccine misinformation.
Introduction
Social factors, such as information sharing, play a crucial role in shaping the dynamics and epidemiology of infectious diseases1,2. For instance, a population’s willingness to adopt public health measures (or lack thereof) largely determines their successes or failures3,4. A population’s behavioral response to outbreaks can be influenced by mass media, as witnessed during the 2009 H1N1 influenza pandemic5, or by social media and the anti-vaccination movement6,7,8,9.
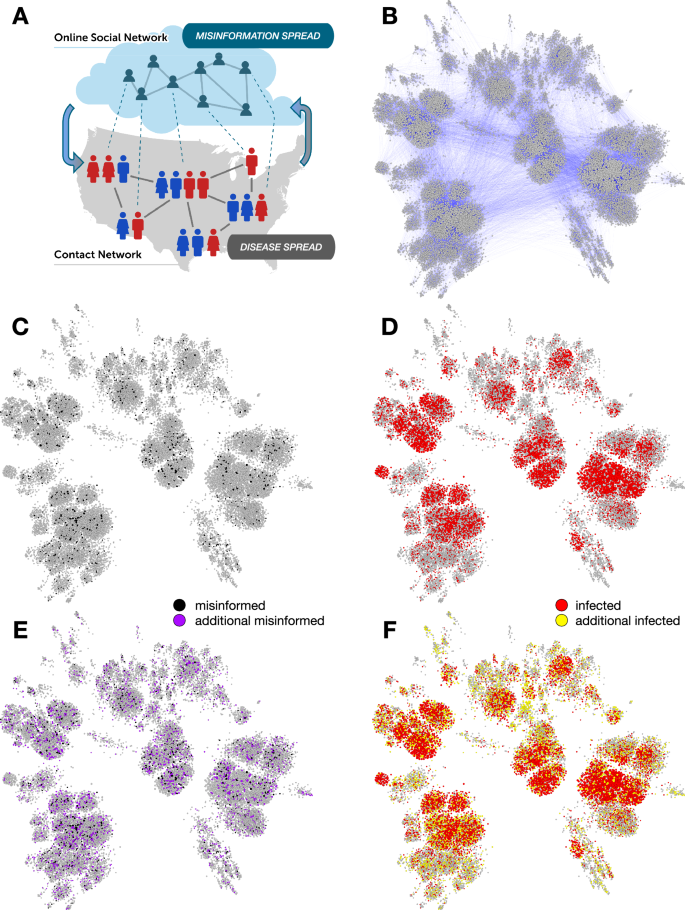
A great deal of work has explored how to model the influence of human behavior on the spread of infectious diseases10,11. Here we focus on risky behaviors affecting disease transmission that are associated with misinformed individuals. Misinformation spreading on social networks has been linked to poor compliance with COVID-19 public health guidance12. Greater exposure to unreliable news articles about COVID-19 vaccines has been linked to an increase in vaccine hesitancy and a decrease in vaccination rates at both state and county levels in the United States13,14. Exposure to online misinformation has also been shown to increase vaccine hesitancy in laboratory experiments15. This is particularly detrimental during vaccination campaigns as clusters of individuals adopting anti-vaccination opinions can make it challenging for a population to reach herd immunity16,17. Proper management of epidemic crises in the modern age thus requires the understanding of the complex relationship between the spread of (mis)information through online social networks and the spread of disease through physical contact networks (Fig. 1).
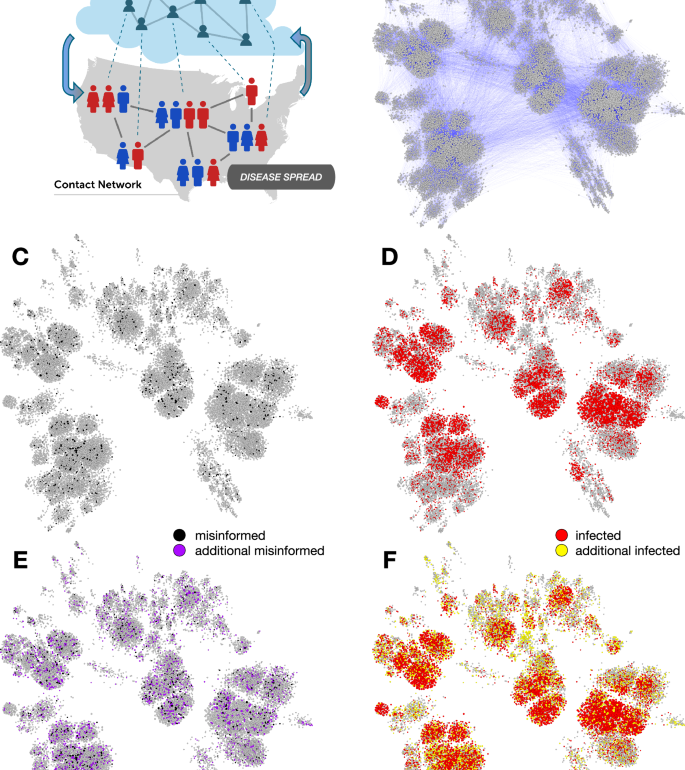
A Schematic illustration of the misinformation and contact networks. Online social networks foster misinformation dissemination while physical contact networks, such as those that connect co-workers in an office or pupils in a school, facilitate disease transmission. Dotted links indicate that the same people participate in both networks, which have different topologies; e.g., the information network tends to have stronger political homophily while the contact network tends to have stronger geographic homophily. We focus on the impact of misinformation spread on disease transmission (downward arrow), while the opposite effect (upward arrow, e.g., individuals ceasing to share misinformation due to illness) falls outside the scope of this investigation. B A contact network based on 0.01% county population samples. Nodes are sized based on degree (number of contacts). In a scenario with limited spread of misinformation (black nodes in C), the simulations of disease spread lead to a number of infected individuals (red nodes in D). In a scenario where the misinformation spreads more widely (purple nodes in E), more individuals get infected (yellow nodes in F).
Agent-based simulations have shown that misinformation may impede the suppression of epidemics in various ways18,19,20,21. One model estimated that between March and November 2021, misinformation caused at least 198 thousand additional COVID-19 cases, 2800 additional deaths, and $299M in additional hospital costs in Canada22. However, there is a growing need to strengthen the connections between simulation results and real-world outcomes by integrating real-world data from social media23,24.
We address this challenge by proposing a data-informed epidemic model that takes both the distribution of misinformed individuals and a physical mobility network into account. Using this data, we augment the susceptible infected recovered (SIR) model to account for a subpopulation of “misinformed” individuals. We refer to this as the susceptible misinformed infected recovered (SMIR) model. We explore how the misinformed group can affect the larger, ordinary population using a multi-level agent-based simulation based on two large, data-informed networks: a social network where misinformation spreads and a contact network where the disease can propagate. A contact network of approximately 20 million nodes is constructed by leveraging large-scale Twitter data, county-level voting records, and cell phone mobility data. We incorporate theoretically extreme values of the parameter responsible for the epidemic transmission to evaluate best- and worst-case scenarios about the impact of misinformed individuals on the spread of disease and obtain quantitative bounds on the harm caused by misinformation. The proposed model lets us move beyond simplified experimental settings to assess the impacts of misinformation25.
Results
We utilize a multi-level, agent-based model to examine the influence of misinformation on epidemic spread. Our approach combines an empirically derived information network with a contact network calibrated with real-world data, as illustrated in Fig. 2. Information diffusion is modeled by leveraging a large set of users of a popular social media platform. Epidemic simulations are subsequently conducted on contact networks populated with misinformed individuals.
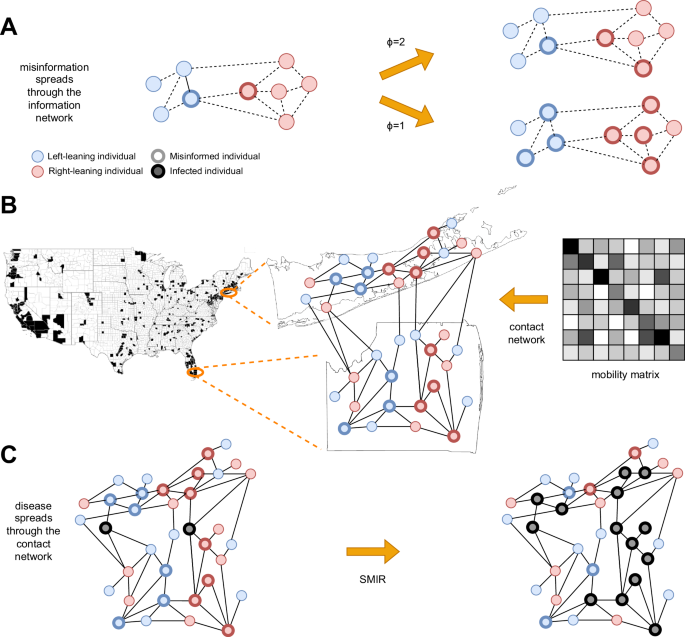
A Spread of misinformation through an information network (dashed lines). Colors represent ideological homophily. Nodes with bold borders are misinformed about the epidemic. The misinformation spreads through a complex contagion (linear threshold) model; two scenarios show that a lower threshold ϕ leads to more misinformed nodes. B Construction of the contact network (solid lines) for counties with sufficient information diffusion data (in black) to provide reasonable estimates about the fraction of misinformed individuals. Note that these counties account for 63.52% of U.S. voters. Each location’s population size and ideological mix are based on empirical data, and misinformed individuals are based on the information diffusion model. Links among individuals within and between locations are based on empirical mobility data. C The infection spreads through the contact network (black nodes), according to the SMIR model.
We start from a large collection of English-language discussions taking place on Twitter about COVID-19 vaccines26. From ~9 months of this data (January 4–September 30, 2021), we geolocate over 2 million U.S. users who shared almost 26 million tweets and focus on accounts in 341 U.S. counties containing more than 200 Twitter users each. We also infer an account’s political alignment and whether they shared any likely misinformation (see the “Methods” section). Twitter is not representative of the U.S. population, and people also access information in other ways, such as traditional media and word of mouth. However, this social media platform serves as one large, realistic network through which people share information about the disease.
With this data, we build a directed and weighted information diffusion network, in which an edge (i → j, w) indicates that j retweeted i w times. There are various ways to model the infodemic27. We simulate the spread of misinformation on this network, as illustrated in Fig. 2A. Accounts that share or reshare posts containing misinformation are considered misinformed. These accounts serve as the initial seeds from which misinformation proliferates, with exposure to this content likely concentrated within the wider network28. Many users may not actively participate in content sharing; for instance, only about half of U.S. Twitter users engage in sharing29. Even without active sharing, exposure to misinformation or misleading content can still influence individual behavior6,15.
To account for users who may be misinformed through exposure, we employ a single-step linear threshold opinion-spreading process30. While many social influence models have been proposed31, this is a simple way to capture complex contagion, according to which individuals may require multiple exposures to misinformation before they become misinformed themselves32,33,34. Let a linear threshold ϕ represent the minimum number of misinformed friends needed for an ordinary node to become misinformed. If the total number of misinformed friends of i is greater than or equal to ϕ, i is marked as misinformed (M). The remaining nodes are marked as ordinary susceptibles (O). We can interpret ϕ as a measure of “resilience” to misinformation; as it increases, individuals require more exposure to misinformation to be converted to the misinformed group. Conversely, we can think of ϕ as inversely related to intent or motivation to engage with low-credibility content35. Note that since we explore the full range of ϕ values, the following results are unaffected whether the threshold is defined based on the number of users or the number of retweets.
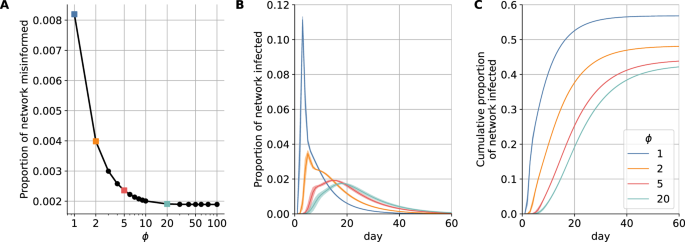
Figure 3A shows how ϕ influences the number of misinformed individuals within the retweet network. With strong resilience (ϕ > 10), exposure to misinformation does not have much effect and few nodes are converted to the misinformed group. Conversely, when resilience to misinformation is very low (as in the simple contagion case ϕ = 1), all nodes exposed to a misinformation-containing post are converted to the misinformed group. Through this process, empirically observed misinformation-sharing behavior leads to information networks with misinformed subpopulations of varying sizes based on different ϕ values.
Decreasing the resilience ϕ (A) increases the size of the misinformed subpopulation, leading to (B) faster infection spreading and (C) a greater cumulative number of infections. In panels (B, C) lines and corresponding shaded regions represent the mean and standard deviation across simulations, respectively.
We generate contact networks for different thresholds (1 ≤ ϕ ≤ 20) to compare the impact of misinformed subpopulations of different sizes. Given a threshold ϕ and the corresponding information network, we aim to construct a physical contact network containing empirically calibrated misinformed subpopulations (Fig. 2B). The process begins by selecting a sample of individuals from each county within the information network. As party affiliation has been identified as a risk factor associated with excess mortality during the COVID-19 pandemic36, county samples are constructed to match the percentage of Republicans and Democrats who voted in the 2020 U.S. presidential election. For each county, we add the sampled nodes to the physical network marked as misinformed (M) or ordinary susceptible (O), based on their label within the retweet network. Sampling with replacement allows us to select individuals such that the overall proportions of Republicans and Democrats match the voting records. A 10% sample leads to N ≈ 20 million nodes. A network based on a much smaller sample is illustrated in Fig. 1B. This process captures empirical measurements of the ideological split, relative population size, and quantity of misinformed individuals in each county. It also allows us to account for the known link between the ideological motivations of users and their exposure to misinformation14,28. We add contact network edges by leveraging cell phone mobility data that provides the probability of an individual traveling within and between counties. See Methods for details.
Disease-spreading dynamics on the contact network are simulated using the SMIR model (Fig. 2C). As in the standard SIR37, a parameter β describes the average number of infected individuals generated by an infected individual in a time unit. We can express (beta =pbar{k}) in terms of two critical parameters that affect the spreading dynamics: the density of the contact network, captured by its average degree (bar{k}), and the transmission probability p. Infected individuals recover with rate γ.
We extend this epidemic model to account for misinformed and ordinary subpopulations. Ordinary individuals are considered to be well-informed about public health guidelines, such as social distancing, mask-wearing, and vaccination. Mitigation measures such as social distancing decrease (bar{k}), while those such as masking and vaccination decrease p. Misinformed individuals, having been exposed to untrustworthy information, are assumed to be less likely to follow these recommended behaviors, thereby increasing the risk of infection for themselves and others38. A simple way to model the combined effects of misinformation on these behaviors through a single parameter is to set (bar{k}=25), a high value corresponding to the average number of daily contacts prior to the COVID-19 pandemic39 and use extreme values of p to capture worst- and best-case scenarios. An effective reduction of contacts, resulting, for example, from social distancing or lockdowns, can be captured by decreasing the p parameter.
We, therefore, model the refusal of any mitigation measures by selecting the maximum value pM = 1 for misinformed individuals. In contrast, we model the adoption of several mitigation measures by selecting an extremely small value pO = 0.01 for ordinary individuals. The former scenario portrays a realistic number of interactions during non-pandemic times, accompanied by high transmission rates due to the absence of preventive measures, such as social distancing, mask-wearing, or vaccinations. The latter demonstrates decreased daily interactions and reduced transmission rates resulting from the implementation of these preventive measures. Using the empirically calibrated contact networks in conjunction with these extreme parameters, the simulation approach allows us to bound the best- and worst-case scenarios in a data-informed manner (see the “Methods” section for more information).
The effects of the misinformed subpopulation size on the daily incidence of infection (illustrated in Fig. 1C–F on a small network) are quantified in Fig. 3B on a large network (10% sample). The worst case capturing a heavily misinformed population (ϕ = 1) corresponds to an additional 9% of the population being infected at peak time (a six-fold increase) compared to a resilient population following expert guidance in the best-case scenario (ϕ = 20). The peak also occurs approximately two weeks earlier. The cumulative effect is also significant, with an additional 14% of the population infected over the course of the epidemic compared to cases with a more resilient population—a 32% relative increase (Fig. 3C).
We explored alternative scenarios for the ratio pM/pO through a mean-field approximation. Predictably, as this ratio gets larger, the infected population increases and the peak infection occurs earlier. We also considered different sample sizes for the empirical network and found that the main results are robust. These analyses can be found in Supplementary Information.
Discussion
Exposure to online health misinformation is associated with risky behaviors such as vaccine hesitancy and refusal14. There is also experimental evidence suggesting a causal link6,15,40. While one study found no evidence that misinformation reduces intent to vaccinate, the authors report that they did not have sufficient power to detect small effects41. Assuming an association exists between exposure to health misinformation on one particular social media platform and risky behaviors, this work uses large-scale epidemic simulations to further link the behaviors of misinformed individuals to an accelerated spread of disease. Our model is anchored in empirical data23,24 to explore potential outcomes.
Agent-based simulations of the SMIR model let us study the epidemic on empirically calibrated contact networks. By comparing a worst-case scenario, in which individuals become misinformed after a single exposure to low-credibility content, to a best-case scenario where the population is highly resilient to misinformation, the model estimates that the peak of the infection is amplified by a factor of six and accelerated by two weeks. This would result in an additional 14% of the population becoming infected—nearly 47 million Americans based on recent U.S. Census data42. The corresponding price tag of vaccine misinformation would be over $143B, using estimated healthcare costs associated with COVID-19 in the U.S.43.
While these figures are based on extreme scenarios, they represent an alarming bound on the harm of exposure to online vaccine misinformation. They should provide public health authorities as well as social media platforms with heightened motivation to curb vaccine misinformation, despite the difficulties posed by social media design44.
Our results do not address the differential effects of the epidemic on the two populations of ordinary and misinformed individuals. We carry out such an analysis using a mean-field approximation of the model, which assumes all individuals have an equal chance of interacting. The mean-field model demonstrates how the risky behaviors of misinformed individuals can adversely impact those following public health guidelines, worsening outcomes for the entire population (see Supplementary Information). Additionally, we use the mean-field model to explore the role of homophily in the population, i.e., scenarios where misinformed individuals are more likely to be connected to other misinformed individuals and similarly for the ordinary population. We find that increasing homophily can benefit the overall population by protecting ordinary citizens; however, it may also lead to higher infection rates within the misinformed subpopulation (see Supplementary Information).
We acknowledge several limitations in our approach. The model assumes the existence of a causal link between exposure to online misinformation and the adoption of risky behaviors. There is a need for models that can provide support for this assumption beyond existing lab experiments6,15.
Using empirical retweet data as a proxy for social connections may not capture potential passive exposure to misinformation. While follower relationships could diminish this limitation, our choice allows us to focus on users who are more likely to be impacted due to their active engagement.
We model a single wave of infection with somewhat arbitrary extreme-case parameters (pO = 0.01, pM = 1). A broader range of values is explored in a mean-field scenario, along with the effect of the size of the misinformed population (see Supplementary Information). Of course, as pO → 0, only the misinformed population can get infected in the model. However, since the mean-field scenario ignores the network structure, its results cannot be directly compared to those of the agent-based model. COVID-19 saw multiple waves of infection with different variants, varying reproduction numbers, levels of immunity, and so on. Future work should attempt to quantify the potential effects of misinformation in more realistic scenarios, where the key parameters pM and pO could be calibrated on empirical surveillance data from particular regions and time periods.
We also assume uniform resilience to misinformation for all individuals during the information diffusion process, although this attribute likely differs across individuals. Future directions could involve more sophisticated models to account for these heterogeneities. For instance, cognitive models of misinformation acceptance45 could be incorporated into the simulation with misinformation exposure data collected from social media. Such integration would enable the transition of individuals from ordinary to misinformed susceptible states throughout the simulation, allowing for a simultaneous examination of opinion and disease dynamics. Some theoretical models have already explored similar approaches and obtained results that align with our findings18,19.
Finally, although individual beliefs and behaviors may vary over time, our model simplifies the scenario by dichotomizing individuals into misinformed and ordinary subpopulations and assuming constant transmission rates. Future extensions of the model could account for a feedback loop whereby witnessing local infections could drive changes in behaviors equivalent to the transition of individuals out of the misinformed population46.
Methods
Twitter and derived data
Twitter posts in the CoVaxxy dataset26 were collected in real-time via the stream/filter endpoint of the Twitter Application Programming Interface (API). To capture the online discourse surrounding COVID-19 vaccines in English, a comprehensive set of English-language keywords was carefully curated. Beginning with the initial seeds of “covid” and “vaccine,” a snowball sampling technique47 was used to identify co-occurring relevant keywords in December 202026. The resulting list contained almost 80 keywords, available online48. To confirm the relevance of the collected tweets to the topic of vaccines, we examined the coverage obtained by incrementally adding keywords, starting with the most common ones. Over 90% of the tweets in 2021 contained at least one of the three most common keywords: “vaccine,” “vaccination,” or “vaccinate.” To infer the location of accounts, we used the Carmen Python library49 that leverages self-reported location metadata within user profiles (embedded in tweets). As an account’s location may change over time (captured across multiple tweets), we utilize the most recent location. We geolocate 2,047,800 users residing in all 50 U.S. states, who shared a total of 25,806,856 tweets by mapping self-reported locations to U.S. counties. The information network is constructed from accounts in 341 counties that contain more than 200 Twitter users each. Political alignment is estimated using a third-party list of annotated news sources50,51. It is averaged across all the sources shared by each account. Nodes with an estimated alignment greater (smaller) than zero are considered Republican (Democrat). We infer the political alignment of some additional accounts, who did not share links to news sources, using a label-propagation algorithm52 on the retweet network. If all of a node’s neighbors have political alignment scores, its score is estimated using the weighted average of its neighbors, with weights based on retweets. The process is iterated until each node without a score has at least one neighbor without a score. Misinformation is defined at the source level. Tweets containing links to articles from a list of low-credibility sources compiled by NewsGuard (score below 60) are labeled as spreading misinformation. This approach is common practice and has been validated in the literature14,53,54,55,56.
Contact network edges
To construct edges in our contact network, we utilize SafeGraph cell-phone mobility data57, which contains information on the number of people residing in over 200K Census-Block-Groups (CBG) who visited 4.3M Points-of-Interest (POI) in the United States. This data has been widely employed to study human mobility patterns during the COVID pandemic. We used the average daily number of individuals moving during 2019 as a reference for business-as-usual mobility and aggregated all CBGs and POIs at the county level. This aggregation results in a county-by-county matrix L, where each element Lxy represents the average daily number of individuals in county x moving to county y or vice versa. We then normalized Lxy to obtain the average probability of individuals in counties x and y coming into contact and multiplied by the total number of edges to obtain the expected number of connections between individuals in counties x and y: ({E}_{xy}=frac{{L}_{xy}}{{sum }_{{x}^{{prime} },{y}^{{prime} }}{L}_{{x}^{{prime} }{y}^{{prime} }}}frac{bar{k}N}{2}) where the sum is over all county pairs and (frac{bar{k}N}{2}) is the total number of edges. Next, we create a physical contact network with N nodes by following a procedure akin to a stochastic block model58 used to generate networks with localized communities. For each pair of distinct locations x and y, we draw Exy edges between random pairs of nodes in x and y. Additionally, we draw Exx edges among random pairs of individuals within the same location x, representing homogeneous mixing within each county. At the end of the process, the network has the target average degree (bar{k}). We use (bar{k}=25) and show how this parameter affects the infections in Supplementary Information.
Simulation details
Agent-based SMIR simulations are initiated by randomly selecting 100 misinformed nodes and designating them as infected. The disease-spreading dynamics are then simulated for 100 steps, which correspond to days. To align with COVID-19 dynamics, we utilize the CDC’s recommended quarantine period of 5 days as our recovery period59 (γ = 0.2). Each simulation is repeated ten times, and the average outcome is reported.
Data availability
Data are available in a public repository: https://github.com/osome-iu/bounding-misinfo-impact-on-disease-spread.
Code availability
Code is available in a public repository: https://github.com/osome-iu/bounding-misinfo-impact-on-disease-spread.
References
-
Buckee, C., Noor, A. & Sattenspiel, L. Thinking clearly about social aspects of infectious disease transmission. Nature 595, 205–213 (2021).
-
Bavel, J. J. V. et al. Using social and behavioural science to support COVID-19 pandemic response. Nat. Hum. Behav. 4, 460–471 (2020).
-
Mitze, T., Kosfeld, R., Rode, J. & Wälde, K. Face masks considerably reduce COVID-19 cases in Germany. Proc. Natl Acad. Sci. USA 117, 32293–32301 (2020).
-
Bauch, C. T. & Galvani, A. P. Social factors in epidemiology. Science 342, 47–49 (2013).
-
Poletti, P., Ajelli, M. & Merler, S. The effect of risk perception on the 2009 H1N1 pandemic influenza dynamics. PLoS ONE 6, e16460 (2011).
-
Allen, J., Watts, D. J. & Rand, D. G. Quantifying the impact of misinformation and vaccine-skeptical content on Facebook. Science 384, eadk3451 (2024).
-
Gallotti, R., Valle, F., Castaldo, N., Sacco, P. & De Domenico, M. Assessing the risks of ‘infodemics’ in response to COVID-19 epidemics. Nat. Hum. Behav. 4, 1285–1293 (2020).
-
Broniatowski, D. A. et al. Weaponized health communication: Twitter bots and Russian trolls amplify the vaccine debate. Am. J. Public Health 108, 1378–1384 (2018).
-
Burki, T. Vaccine misinformation and social media. Lancet Digit. Health 1, e258–e259 (2019).
-
Verelst, F., Willem, L. & Beutels, P. Behavioural change models for infectious disease transmission: a systematic review (2010–2015). J. R. Soc. Interface 13, 20160820 (2016).
-
Funk, S., Salathé, M. & Jansen, V. A. A. Modelling the influence of human behaviour on the spread of infectious diseases: a review. J. R. Soc. Interface 7, 1247–1256 (2010).
-
Roozenbeek, J. et al. Susceptibility to misinformation about COVID-19 around the world. R. Soc. Open Sci. 7, 201199 (2020).
-
Rathje, S., He, J. K., Roozenbeek, J., Van Bavel, J. J. & van der Linden, S. Social media behavior is associated with vaccine hesitancy. PNAS Nexus 1, https://doi.org/10.1093/pnasnexus/pgac207 (2022).
-
Pierri, F. et al. Online misinformation is linked to early COVID-19 vaccination hesitancy and refusal. Sci. Rep. 12, 1–7 (2022).
-
Loomba, S., de Figueiredo, A., Piatek, S. J., de Graaf, K. & Larson, H. J. Measuring the impact of COVID-19 vaccine misinformation on vaccination intent in the UK and USA. Nat. Hum. Behav. https://doi.org/10.1038/s41562-021-01056-1 (2021).
-
Chan, H.-W. et al. Not-so-straightforward links between believing in COVID-19-related conspiracy theories and engaging in disease-preventive behaviours. Humanit. Soc. Sci. Commun. 8, 1–10 (2021).
-
Salathé, M. & Khandelwal, S. Assessing vaccination sentiments with online social media: implications for infectious disease dynamics and control. PLoS Comput. Biol. 7, e1002199 (2011).
-
Sontag, A., Rogers, T. & Yates, C. A. Misinformation can prevent the suppression of epidemics. J. R. Soc. Interface 19, 20210668 (2022).
-
Mumtaz, N., Green, C. & Duggan, J. Exploring the effect of misinformation on infectious disease transmission. Systems 10, 50 (2022).
-
Prandi, L. & Primiero, G. Effects of misinformation diffusion during a pandemic. Appl. Netw. Sci. 5, 1–20 (2020).
-
Brainard, J. & Hunter, P. R. Misinformation making a disease outbreak worse: outcomes compared for influenza, monkeypox, and norovirus. Simulation 96, 365–374 (2019).
-
Himelfarb, A. et al. Fault Lines: Expert Panel on the Socioeconomic Impacts of Science and Health Misinformation. Technical Report (Council of Canadian Academies, 2023).
-
Bedson, J. et al. A review and agenda for integrated disease models including social and behavioural factors. Nat. Hum. Behav. 5, 834–846 (2021).
-
Sooknanan, J. & Comissiong, D. M. G. Trending on social media: integrating social media into infectious disease dynamics. Bull. Math. Biol. 82, 1–11 (2020).
-
Tay, L. Q., Lewandowsky, S., Hurlstone, M. J., Kurz, T. & Ecker, U. K. H. Thinking clearly about misinformation. Commun. Psychol. 2, 1–5 (2024).
-
DeVerna, M. R. et al. CoVaxxy: a collection of English-language Twitter posts about COVID-19 vaccines. In Proc. International AAAI Conference on Web and Social Media, Vol. 15, 992–999 (AAAI Press, 2021).
-
D’Andrea, V. et al. Epidemic proximity and imitation dynamics drive infodemic waves during the COVID-19 pandemic. Phys. Rev. Res. 4, 013158 (2022).
-
Budak, C., Nyhan, B., Rothschild, D. M., Thorson, E. & Watts, D. J. Misunderstanding the harms of online misinformation. Nature 630, 45–53 (2024).
-
Odabaş, M. 5 Facts About Twitter ‘lurkers’ https://www.pewresearch.org/fact-tank/2022/03/16/5-facts-about-twitter-lurkers (Pew Research Center, 2022).
-
Granovetter, M. Threshold models of collective behavior. Am. J. Sociol. https://doi.org/10.1086/226707 (1978).
-
Castellano, C., Fortunato, S. & Loreto, V. Statistical physics of social dynamics. Rev. Mod. Phys. 81, 591–646 (2009).
-
Centola, D. The spread of behavior in an online social network experiment. Science 329, 1194–1197 (2010).
-
Weng, L., Menczer, F. & Ahn, Y.-Y. Virality prediction and community structure in social networks. Sci. Rep. 3, https://doi.org/10.1038/srep02522 (2013).
-
Mønsted, B., Sapieżyński, P., Ferrara, E. & Lehmann, S. Evidence of complex contagion of information in social media: an experiment using Twitter bots. PLoS ONE 12, e0184148 (2017).
-
Simon, F. M. & Camargo, C. Q. Autopsy of a metaphor: the origins, use and blind spots of the ‘infodemic’. N. Media Soc. 25, 2219–2240 (2021).
-
Jacob Wallace, P. Excess death rates for Republican and Democratic registered voters in Florida and Ohio during the COVID-19. JAMA Intern. Med. https://jamanetwork.com/article.aspx?doi=10.1001/jamainternmed.2023.1154 (2023).
-
Anderson, R. M. & May, R. M. Infectious Diseases of Humans: Dynamics and Control (Oxford University Press, 1991).
-
D’Andrea, V., Gallotti, R., Castaldo, N. & De Domenico, M. Individual risk perception and empirical social structures shape the dynamics of infectious disease outbreaks. PLoS Comput. Biol. 18, e1009760 (2022).
-
Liu, C. Y. et al. Rapid review of social contact patterns during the COVID-19 pandemic. Epidemiology 32, https://doi.org/10.1097/EDE.0000000000001412 (2021).
-
Thaker, J. & Subramanian, A. Exposure to covid-19 vaccine hesitancy is as impactful as vaccine misinformation in inducing a decline in vaccination intentions in New Zealand: results from pre-post between-groups randomized block experiment. Front. Commun. 6, https://doi.org/10.3389/fcomm.2021.721982 (2021).
-
Porter, E., Velez, Y. & Wood, T. J. Correcting COVID-19 vaccine misinformation in 10 countries. R. Soc. Open Sci. 10, 221097 (2023).
-
United States Census Bureau. Population Clock https://www.census.gov/popclock (2023).
-
Bartsch, S. M. et al. The potential health care costs and resource use associated with COVID-19 in the United States. Health Aff. 39, 927–935 (2020).
-
Broniatowski, D. A., Simons, J. R., Gu, J., Jamison, A. M. & Abroms, L. C. The efficacy of Facebook’s vaccine misinformation policies and architecture during the COVID-19 pandemic. Sci. Adv. 9, eadh2132 (2023).
-
Borukhson, D., Lorenz-Spreen, P. & Ragni, M. When does an individual accept misinformation? An extended investigation through cognitive modeling. Comput. Brain Behav. 5, 244–260 (2022).
-
Zeng, R., Chang, X. & Liu, B. Evolutionary modeling and analysis of opinion exchange and epidemic spread among individuals. Front. Phys. 12, https://doi.org/10.3389/fphy.2024.1501807 (2024).
-
Di Giovanni, M., Pierri, F., Torres-Lugo, C. & Brambilla, M. VaccinEU: COVID-19 vaccine conversations on Twitter in French, German and Italian. In Proc. International AAAI Conference on Web and Social Media, Vol. 16, 1236–1244 (AAAI Press, 2022).
-
DeVerna, M. R. et al. CoVaxxy Tweet IDs dataset. Zenodo https://doi.org/10.5281/zenodo.7752586 (2021).
-
Dredze, M., Paul, M. J., Bergsma, S. & Tran, H. Carmen: A Twitter geolocation system with applications to public health. In Proc. AAAI Workshop on Expanding the Boundaries of Health Informatics Using AI (HIAI), Vol. 23, 45 (2013).
-
Robertson, R. E. et al. Auditing Partisan audience bias within Google Search. Proc. ACM Hum.-Comput. Interact. 2, 1–22 (2023).
-
Robertson, R. Partisan Bias Scores for Web Domains. Harvard Dataverse https://doi.org/10.7910/DVN/QAN5VX (2018).
-
Conover, M., Gonçalves, B., Ratkiewicz, J., Flammini, A. & Menczer, F. Predicting the political alignment of Twitter users. In Proc. 3rd IEEE Conference on Social Computing (SocialCom) 192–199 (2011).
-
Grinberg, N., Joseph, K., Friedland, L., Swire-Thompson, B. & Lazer, D. Fake news on Twitter during the 2016 US presidential election. Science 363, 374–378 (2019).
-
Bovet, A. & Makse, H. A. Influence of fake news in Twitter during the 2016 US presidential election. Nat. Commun. 10, 7 (2019).
-
Lazer, D. M. et al. The science of fake news. Science 359, 1094–1096 (2018).
-
Shao, C. et al. The spread of low-credibility content by social bots. Nat. Commun. 9, 1–9 (2018).
-
Yuan, Y., Jahani, E., Zhao, S., Ahn, Y.-Y. & Pentland, A. S. Implications of COVID-19 vaccination heterogeneity in mobility networks. Commun. Phys. 6, 206 (2023).
-
Karrer, B. & Newman, M. E. Stochastic blockmodels and community structure in networks. Phys. Rev. E 83, 016107 (2011).
-
Centers for Disease Control and Prevention. Isolation and Precautions for People with COVID-19 https://www.cdc.gov/coronavirus/2019-ncov/your-health/isolation.html (Centers for Disease Control and Prevention, 2023).
Acknowledgements
We are grateful to Yuan Yuan, Marco Ajelli, Alessio Brina, and Brea Perry for their helpful discussions. This work was supported in part by the Swiss National Science Foundation (grant 209250), the National Science Foundation (grants 1927425 and 1927418), the Army Research Office (contract W911NF-21-1-0194), the European Union (NextGenerationEU project PNRR-PE-AI FAIR), the Italian Ministry of Education (PRIN PNRR grant CODE prot. P2022AKRZ9 and PRIN grant DEMON prot. 2022BAXSPY), Knight Foundation, and Craig Newmark Philanthropies.
Author information
Authors and Affiliations
Contributions
The initial concept for this research was developed by Y.-Y.A., S.F., A.F., and F.M. The final study design was developed collectively by all authors. Data collection was led by M.R.D. as part of the CoVaxxy project. All mean-field modeling was conducted by M.R.D. F.P. developed the early code for the agent-based simulation, which was subsequently refined and expanded by M.R.D. for publication. Analysis was conducted primarily by M.R.D., with help from F.P., and guidance from Y.-Y.A., S.F., A.F., and F.M. The SMIR model was developed collaboratively by all authors. Visualizations were created by M.R.D., F.P., and F.M. with input from all authors. The first draft was written by M.R.D., with revisions from all authors. F.M. oversaw the progression of the study.
Corresponding author
Ethics declarations
Competing interests
The authors declare no competing interests.
Ethics
This study, focusing on public data, poses minimal risk to human subjects. Consequently, the Indiana University Institutional Review Board has exempted it from review (protocol number 1102004860). All data collection and analysis adhered to Twitter’s terms of service.
Additional information
Publisher’s note Springer Nature remains neutral with regard to jurisdictional claims in published maps and institutional affiliations.
Supplementary information
Rights and permissions
Open Access This article is licensed under a Creative Commons Attribution 4.0 International License, which permits use, sharing, adaptation, distribution and reproduction in any medium or format, as long as you give appropriate credit to the original author(s) and the source, provide a link to the Creative Commons licence, and indicate if changes were made. The images or other third party material in this article are included in the article’s Creative Commons licence, unless indicated otherwise in a credit line to the material. If material is not included in the article’s Creative Commons licence and your intended use is not permitted by statutory regulation or exceeds the permitted use, you will need to obtain permission directly from the copyright holder. To view a copy of this licence, visit http://creativecommons.org/licenses/by/4.0/.
About this article
Cite this article
DeVerna, M.R., Pierri, F., Ahn, YY. et al. Modeling the amplification of epidemic spread by individuals exposed to misinformation on social media.
npj Complex 2, 11 (2025). https://doi.org/10.1038/s44260-025-00038-y
-
Received:
-
Accepted:
-
Published:
-
DOI: https://doi.org/10.1038/s44260-025-00038-y
This post was originally published on this site be sure to check out more of their content

