Data
This study uses data from the Chinese General Social Survey (CGSS). The CGSS collects data through a multi-stage stratified random sampling approach. As part of the basic sampling process, districts (counties) are randomly selected across the country as first-level sampling units, followed by street (township) and resident (village) committees selected as second- and third-level sampling units; finally, a random sample of households is selected for the survey, and then a random sample of one individual is selected from each household. The first round of the CGSS was conducted in 2003, followed by ten rounds in 2005, 2006, 2008, 2010, 2011, 2012, 2013, 2015, 2017, and 2018. For empirical analysis, this study uses only the data from 2018 because items related to social media use and environmental attitudes are only found in this year’s data. There are 3697 people be included in the analysis after excluding those with missing values. For more information on data collection, data quality, and sample representativeness, readers can visit the official website of the Chinese General Social Survey [63, 69].
Measurement indicators
Environmental awareness is the dependent variable in this study. We use the following question in the survey to measure environmental awareness: “People should make some economic sacrifices to protect the environment, how strongly do you agree with this statement?”. Answer options include “strongly disagree”, “disagree”, “neutral”, “agree”, and “strongly agree”, assigned values of 1, 2, 3, 4, and 5. A higher score indicates a greater level of environmental awareness among residents. Generally, the higher the score, the greater the degree of environmental awareness among the residents.
In this study, the treatment variable is the frequency of WeChat usage (D). We use the number of WeChat friends as a proxy variable for the frequency of WeChat usage, with a median of 30 as the threshold. If an individual has more than 30 WeChat friends, we consider them to frequently use WeChat, and D takes the value of 1. If an individual has 30 or fewer WeChat friends, we consider them to not use WeChat frequently, and D takes the value of 0.
Environmental knowledge was assessed by asking participants to rate their agreement with three statements: (1) Energy use is the primary cause of smog; (2) Energy use is the primary cause of the greenhouse effect; and (3) Energy use is the primary cause of acid rain. Responses were recorded on a 5-point scale ranging from 1 (strongly disagree) to 5 (strongly agree). The scores for the three items were summed and then divided by 3 to compute the Environmental Knowledge score (Cronbach’s α = 0.78, M = 2.62, SD = 1.34).
Environmental risk perception was measured by asking participants to rate their agreement with the statement: ‘The air quality in the area where I lived in 2017 was very good.’ Responses were recorded on a 5-point scale ranging from 1 (strongly agree) to 5 (strongly disagree). A higher score indicates a greater degree of environmental risk perception among residents.
Control variables included in the study are gender, age, education, marital status, health status, social interaction frequency, household registration, party membership, and income level, as they may influence social media behavior and engagement with environmental issues. Research indicates gender differences in social media use, with women more likely to share personal updates and men prioritizing privacy, potentially impacting their environmental engagement [64, 70]. Younger generations, particularly digital natives, tend to use social media more frequently for self-expression, in contrast to older individuals [65, 71]. Education also plays a significant role, as those with higher educational levels are more likely to use social media for information gathering and interaction [66, 72]. Marital status can affect social media behavior, with single or divorced individuals generally being more active than those who are married [64, 70]. Health status and income were controlled for, as individuals with poor health or lower socioeconomic status may use social media less frequently and have different access to environmental information [67, 68, 73, 74]. Additionally, while less studied, household registration and party membership can influence social resources and network structures, affecting social media use [64, 70]. Finally, social interaction frequency was considered, as social media serves as a crucial platform for maintaining and expanding social networks, which may influence engagement with environmental discussions [69, 75].
Among them, gender, household registration, party membership, and marital status are binary variables: male takes the value of 1, female takes the value of 0; agricultural household registration takes the value of 1, non-agricultural household registration takes the value of 0; party member takes the value of 1, non-party member takes the value of 0; married takes the value of 1, unmarried takes the value of 0. Health status is reported by the respondents themselves. In CGSS2018, respondents were asked “How do you rate your current health status?” The coding of the respondents’ answers is as follows: “very unhealthy = 1,” “somewhat unhealthy = 2,” “average = 3,” “somewhat healthy = 4,” and “very healthy = 5,” with a higher value indicating better health. Social interaction is measured by “In the past year, did you often do the following activities in your spare time? – Socializing/visiting,” with the following coding: never = 1, rarely = 2, sometimes = 3, often = 4, very frequently = 5. Annual income is measured by “What was your total income for the past year?” and the answer is transformed into natural logarithm (ln).
This study uses the provincial internet penetration rate as an exclusive instrumental variable to address the potential endogeneity problem between WeChat usage and individual environmental awareness. There is a clear correlation between internet coverage and WeChat usage frequency. As a social, communication, and payment app that relies on the internet, WeChat requires a stable network connection to function properly. In areas with higher internet coverage, residents have easier access to the internet, whether through mobile data or Wi-Fi. Consequently, in provinces with better network infrastructure, the barriers to using WeChat are significantly reduced. Convenient internet access minimizes friction costs, such as poor connectivity or network delays, which in turn increases users’ willingness to use the app.
Internet coverage and environmental awareness may not be entirely exogenous, as both can be influenced by shared economic and social factors. However, this concern is largely mitigated in our research design. In China, mobile internet development has far outpaced fixed broadband, especially in rural and remote areas, where mobile phones are a more affordable means of accessing the internet. As a result, internet coverage is primarily determined by mobile internet availability rather than fixed broadband infrastructure, giving mobile internet coverage a certain level of exogeneity. This is because mobile internet coverage largely depends on the construction of base stations, which are not solely determined by economic factors. First, base station construction is mainly funded by government investment and is not fully reliant on local economic strength. Second, natural factors like terrain and weather conditions play a significant role in base station distribution. For example, flat areas are easier to develop, meaning that even though some of these regions may be less economically developed than mountainous provinces, they often enjoy better mobile internet coverage. For instance, the more developed Hunan province has lower internet coverage than the flatter Shanxi province due to its mountainous terrain.
Thus, internet coverage serves as a reasonably exogenous instrumental variable for WeChat usage frequency. Additionally, we control for key socioeconomic variables, such as individual income and years of education, to minimize omitted variable bias and reduce any potential link between geographic distance and residents’ consumption levels. After accounting for these factors, we believe the exogeneity of our instrumental variable is further strengthened.
Statistical model
Drawing on relevant research developments and findings, this study’s empirical analysis framework is based on the marginal treatment effects (MTE) due to considerations of endogeneity, selection bias, and heterogeneity issues [24, 70, 71, 76]. When heterogeneity and selection bias exist, traditional instrumental variable methods may not accurately estimate the return on WeChat usage. Instead, the local instrumental variable (LIV) method can be used in conjunction with MTE to estimate the heterogeneous returns on WeChat usage [24, 71]. MTE has the following characteristics: firstly, it can reflect the heterogeneity and changing trends of treatment effects; secondly, MTE includes observable and unobservable effects, which can reflect the unobservable heterogeneity and reveal the structural characteristics of individual environmental relationships that change with unobservable factors or selection preferences; finally, by weighting the MTE average, other conventional treatment parameters can be obtained, including the average treatment effect (ATE), the average treatment effect on the treated (ATT), the average treatment effect on the untreated (ATU), and the local average treatment effect (LATE), among others. This paper will compare and analyze these treatment effects. The marginal treatment effects are derived from the following generalized Roy model.
$$:{Y}_{j}={X}^{{prime:}}{beta:}_{j}+{U}_{j},:jin:left{text{0,1}right}$$
(1)
$$:Y=D{Y}_{1}+left(1-Dright){Y}_{0}$$
(2)
$$:D=1left({Z}^{{prime:}}delta:>V:right)$$
(3)
Equation (1) represents the outcome equation, which (:{Y}_{1}) is the result of an individual receiving treatment, and (:{Y}_{0}) is the result of an individual not receiving treatment. X and (:{U}_{j}) are observable and unobservable factors that affect the outcome variable. (:Eleft({Y}_{1}|X=xright)={X}^{{prime:}}{beta:}_{1},::Eleft({Y}_{0}|X=xright)={X}^{{prime:}}{beta:}_{0}). Equation (2) represents the observed outcome, which (:{Y}_{1}) can only observe the result of an individual frequently using WeChat (D=1) or (:{Y}_{0}) not frequently using WeChat (D=0). Equation (3) represents the selection equation, where Z is an observable variable that influences an individual’s choice, including X and the exclusive instrumental variable Ze. V is an unobservable resistance factor in an individual’s decision-making process that reflects individual unobservable heterogeneity, such as personality, ability, and attitude. The indicator function 1(·) shows that an individual’s frequency of using WeChat is jointly determined by the observable and unobservable factors. If(:{:Z}^{{prime:}}delta:>V), then D = 1; otherwise, D = 0. As (:{U}_{1})、(:{U}_{0}) and (:V) are correlated, which are unobservable, identifying causal effects requires the use of Ze.
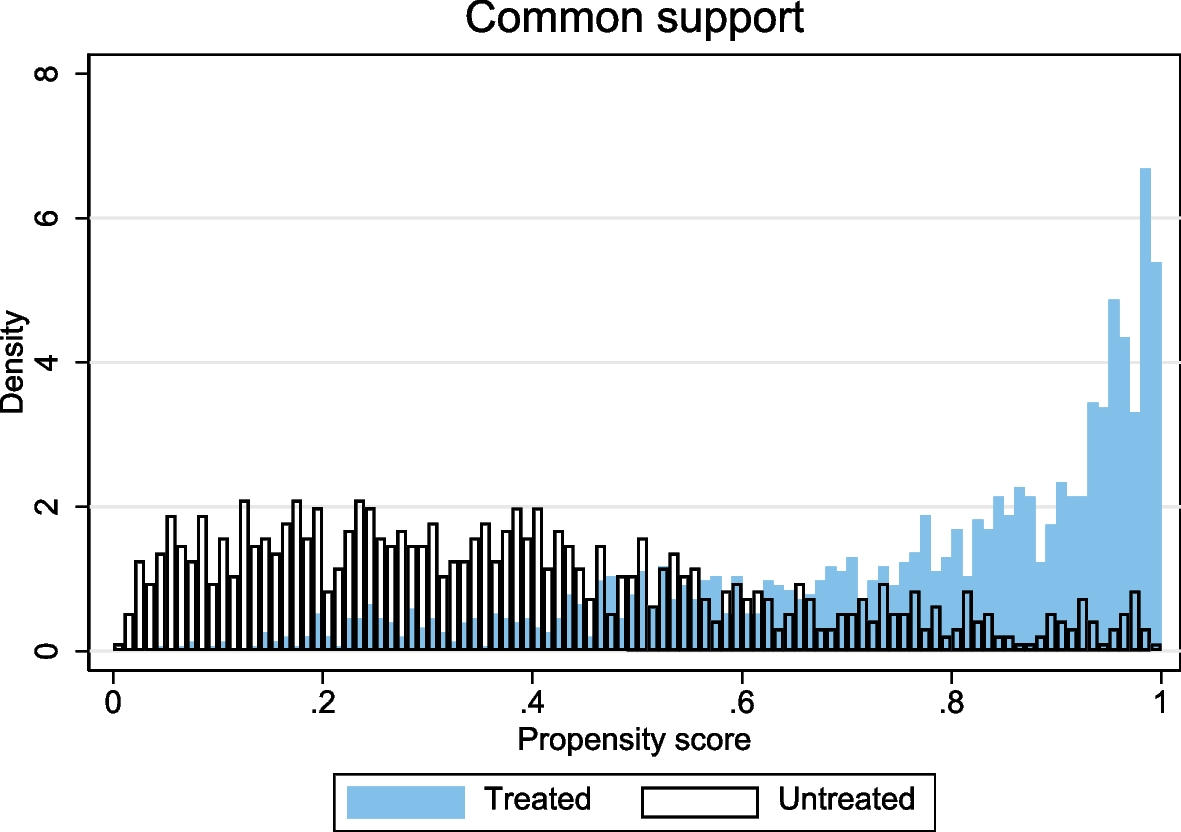
Furthermore, given (:Fvleft(Vright)={U}_{D}) the distribution function of conditional on X, and setting the propensity score (:Pleft(Zright)=text{Pr}left(D=1right|Z=z)), the treatment condition in Eq. (3) is monotonically transformed to obtain (:Pleft(Zright)>{U}_{D}). When (:Pleft(Zright)={U}_{D}=p), the willingness of individuals to frequently or not frequently use WeChat is the same. Therefore, it is only necessary to estimate the conditional expectation of Y and take the derivative with respect to (:p) to obtain MTE. Thus, MTE measures the average treatment effect of “marginal” individuals who frequently or not frequently use WeChat at different values of (:Pleft(Zright)) or (:{U}_{D}). Its expression is as follows:
$$:MTEleft(x,{u}_{D}right)=frac{partial:Eleft(Y|X=x,Pleft(Zright)=pright)}{partial:p}$$
(4)
This equation indicates that, given X, the value of MTE can be determined by each value of (:{U}_{D}). If the (:Pleft(Zright)), observable potential willingness to frequently use WeChat, is low, then the condition of frequently using WeChat is hindered by the unobservable resistance factor (:{U}_{D}), which is lower. A lower indicates that these individuals choose to frequently use WeChat because they are naturally more curious or enjoy online chatting. If their inherent endowments are transformed into future benefits (:({U}_{1}-{U}_{0})), then MTE will change with (:{U}_{D}). If individuals choose their frequency of WeChat usage based on their expected unique benefits, then it will exhibit structural characteristics where benefits are related to individual choices. The essential heterogeneity of unobservable fundamental differences in individual talents and personalities is reflected.
The key to estimating Eq. (4) is to estimate the conditional expectation of Y. Assuming conditional independence, that is, Ze and (:left({U}_{1},::{U}_{0},::Vright)) are independent given X, we obtain:
$$:Eleft(Y|X=x,Pleft(Zright)=pright)={X}^{{prime:}}{beta:}_{0}+{X}^{{prime:}}left({beta:}_{1}-{beta:}_{0}right)p+kleft(pright)$$
(5)
If we assume a function of (:::kleft(pright)=pEleft({U}_{1}-{U}_{0}|{U}_{D}
There are primarily three methods for estimating MTE: local instrumental variable (LIV), separation, and maximum likelihood estimation (MLE). The first two methods are commonly used for semi-parametric models and employ two-stage estimations, while MLE has some limitations as a parameter estimation method, requiring the error term(::left({U}_{1},::{U}_{0},::Vright):) to follow a joint normal distribution. Overall, LIV is more flexible and robust and is widely used in related research. Therefore, this study will use LIV to estimate MTE.
This post was originally published on this site be sure to check out more of their content


