Data
This was a nationally representative cross-sectional survey study of adults aged 18 and older in the US. Data were from the 2022 Life in America Survey, which was designed by the authors and administered online in English and Spanish from May 13 to June 2, 2022, by the survey research firm Ipsos (Ipsos 2023). Survey respondents were drawn from the Ipsos KnowledgePanel, an online research panel with members recruited through address-based probability sampling that has been widely used in population-based research (Kravitz-Wirtz et al. 28,48,49,; Miller et al. 2022; Schleimer et al. 2019; Wintemute et al. 2022). Invitations were sent via e-mail with e-mail and telephone reminders beginning three days later. Recruited adults were provided a web-enabled device and free internet, if needed. Survey weights were applied to adjust for initial probability of selection and for survey-specific non-response and over- or under-coverage using design weights with post-stratification raking ratio adjustments. With weighting, the sample is designed to statistically represent the non-institutionalized adult population of the US as reflected in the 2021 March supplement of the Current Population Survey, the most recent release at the time of our survey. Participants were provided informed consent language before accessing the questionnaire that concluded, “(by) continuing, you are agreeing to participate in this study.” Additional details about the survey methods are described elsewhere (Wintemute et al. 2023). The study is reported following 2021 American Association for Public Opinion Research guidelines (AAPOR 2022), and was approved by the University of California, Davis Institutional Review Board.
Exposure
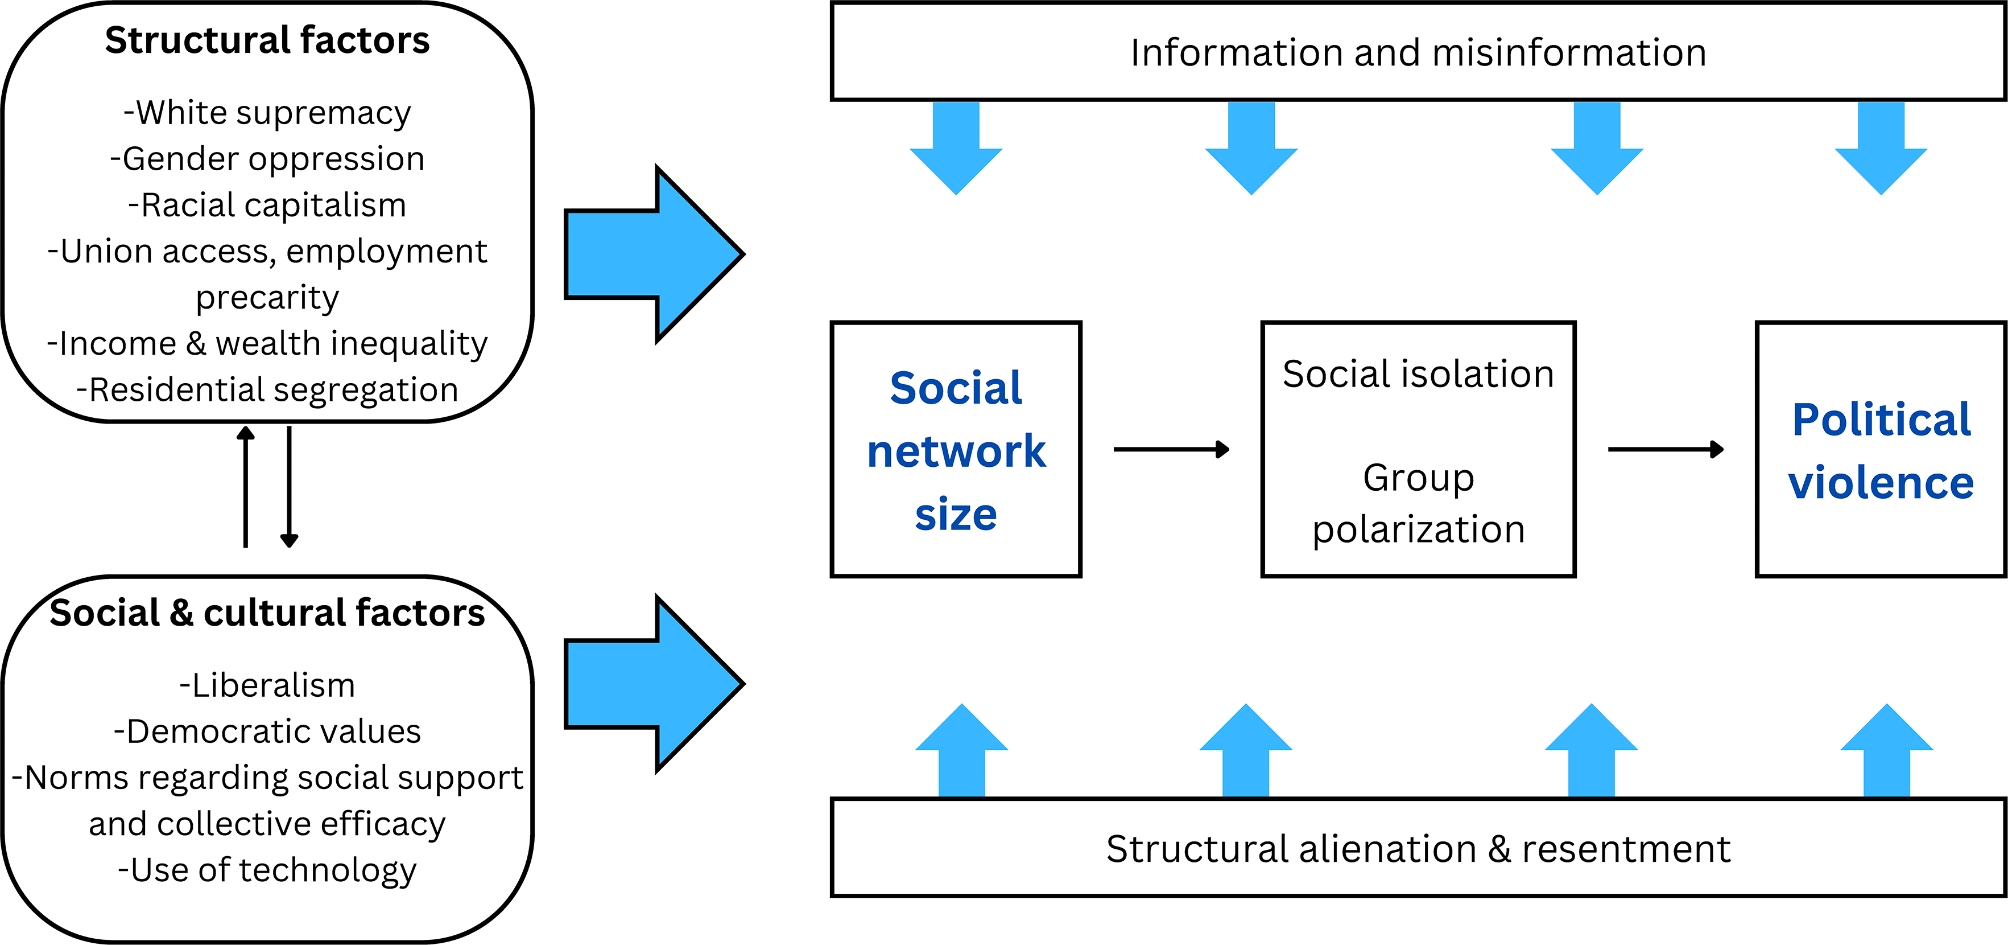
The main exposure was social network size, defined by the number of strong social connections (“the people with whom you have a personal or work relationship and communicate with regularly”) that respondents reported in response to the question: “How many people are there, other than yourself, with whom you have a strong connection?” Response options were 0, 1–4, 5–9, 10–19, 20–49, and 50 or more.
Outcomes
We examined three types of violence-related outcomes: (1) support for “force or violence,” hereafter “non-political violence” (with force or violence defined as “physical force strong enough that it could cause pain or injury to a person”); (2) support for political violence (defined as “force or violence to achieve political objectives”); and (3) personal willingness to engage in political violence. While the focus of our study was on political violence, we included non-political violence to assess the specificity of our findings.
Support for non-political violence was measured in 7 situations. Support for political violence was measured both in general and in 17 situations (each respondent saw 13). Personal willingness to engage in political violence was measured for 16 types and targets of political violence, three of which referred to social networks: “use force or violence as part of a group of people who share your beliefs,” “use force or violence on your own, as an individual,” and “organize a group of people who share your beliefs to use force or violence.”
Response options for non-political and political violence support were “always,” “usually,” “sometimes,” and “never” justified. We grouped responses into usually/always and never/sometimes. Response options for personal willingness to engage in political violence were “completely,” “very,” “somewhat,” and “not at all” willing. We grouped responses into very/completely and not at all/somewhat willing. Respondents were categorized as supportive of or willing to use violence if they indicated usually/always justified or very/completely willing, respectively, for at least one situation, type, or target presented.
Modifiers
We examined effect measure modification of the relationship between social network size and violence outcomes by whether respondents reported any social media platform as a major source of news, whether they reported viewing at least one government institutions as an enemy, and whether they self-identified membership in a systemically marginalized or privileged racial or ethnic group.
Social media as a source of news was measured by asking respondents: “How much do you use each of the following Internet sites and apps as a source of news and information?” for 15 social media platforms, with response options: not a source, minor source, and major source. Social media platforms included: Facebook/Meta, Twitter (now X), LinkedIn, Parler, YouTube, Instagram, Tik Tok, Reddit, Rumble, 8chan/8kum, Telegram, WhatsApp, Signal, Truth Social, and Gab. We categorized respondents by whether they indicated that at least one social media platform was a major source of news vs. none.
Perceptions of the government as an enemy were measured by asking respondents: ‘On a scale of 1 to 5—where “1” means you think the institution is your enemy and “5” means you think the institution is your friend—where on this scale would you place yourself?’ for 7 institutions. Institutions included: the federal government, state government, local government, police and sheriffs, courts and judges, military and national guard, and state and local health departments. We categorized respondents by whether they indicated at least one government institution was a 1 or 2 on the friend-enemy scale vs. none (i.e., all institutions were a 3, 4 or 5 on the friend-enemy scale).
Membership in a systemically marginalized or privileged racial or ethnic group was self-reported (check all that apply) as part of KnowledgePanel profile data. Because the US was built on and continues to be shaped by White supremacy ideology and culture (Bonilla-Silva 1997), we dichotomized racial or ethnic group identity as non-Hispanic White vs. non-White race or Hispanic ethnicity including two or more races (hereafter “non-White”) for analyses.
Survey questions and response options for all key variables are in Supplementary Material 1: Table S1.
Analysis
We calculated unweighted counts and weighted percentages and 95% confidence intervals (CIs). We estimated prevalence ratios (PRs) and adjusted prevalence ratios (aPR) for associations using survey-weighted Poisson regression with robust standard errors. Hypothesized confounders included the following self-reported variables: individual age (measured continuously in years), sex (female and male), annual household income (less than $10,000; $10,000 to $24,999; $25,000 to $49,999; $50,000 to $74,999; $75,000 to $99,999; $100,000 to $149,999; $150,000 or more), education (no high school or General Educational Development [GED], high school or GED, some college or associates, bachelor’s degree, master’s degree or higher), employment status (working full time, working part time, not working), and political party affiliation (strong Republican, not strong Republican, leans Republican, undecided/independent/other, leans Democrat, not strong Democrat, and strong Democrat). Regression models treated social network size of 1–4 connections as the referent since this was the largest group. We tested for interactions using likelihood ratio tests with alpha of < 0.20, as suggested by Jewell 2004, since interactions reduce power to detect associations which may be of scientific interest (Jewell 2004). Analyses were conducted in Stata, release 18.0 (StataCorp LLC).
Secondary and sensitivity analysis
In secondary analyses, we examined the associations of social network size with each of the 17 situations in which respondents might justify political violence and each of the 16 types and targets of violence for which respondents might be personally willing to engage in political violence.
We also defined social networks both by size and uniformity. We used the question: “Thinking again about the people with whom you have a strong connection, what percentage of them share your beliefs about the use of force or violence to advance important political objectives that they support?” Response options were none/almost none of them, less than half of them, about half of them, more than half of them, all/nearly all of them, and don’t know. We defined shared beliefs dichotomously, by those who reported that half or less than half of their close connections share their beliefs about political, including don’t know, and those who reported that more than half of their close connected share their beliefs about political violence. We then created a variable representing the intersection of social network size and shared beliefs.
In a sensitivity analysis, we repeated the main analysis after removing 447 individuals who indicated that any of two fake social media platforms were a major or minor source of news and information (included in the survey as attention checks). These fake social media platforms were not used to construct the variable categorizing social media as a major source of news, but we conducted this sensitivity analysis because individuals who endorsed these fake sources may have responded unreliably to other questions.
We further examined effect measure modification by perceptions of the government as an enemy using an alternative cutoff in which respondents were categorized by whether they indicated at least one government institution was a 1 on the friend-enemy scale vs. none (i.e., all institutions were a 2, 3, 4 or 5 on the friend-enemy scale).
Finally, we examined effect measure modification by continuous versions of modifiers to assess possible dose response.
This post was originally published on this site be sure to check out more of their content


