Abstract
Event-based surveillance is crucial for the early detection and rapid response to potential public health risks. In recent years, social networking services (SNS) have been recognized for their potential role in this domain. Previous studies have demonstrated the capacity of SNS posts for the early detection of health crises and affected individuals, including those related to infectious diseases. However, the reliability of such posts, being subjective and not clinically diagnosed, remains a challenge. In this study, we address this issue by assessing the classification performance of transformer-based pretrained language models to accurately classify Japanese tweets related to heat stroke, a significant health effect of climate change, as true or false. We also evaluated the efficacy of combining SNS and artificial intelligence for event-based public health surveillance by visualizing the data on correctly classified tweets and heat stroke emergency medical evacuees in time–space and animated video, respectively. The transformer-based pretrained language models exhibited good performance in classifying the tweets. Spatiotemporal and animated video visualizations revealed a reasonable correlation. This study demonstrates the potential of using Japanese tweets and deep learning algorithms based on transformer networks for event-based surveillance at high spatiotemporal levels to enable early detection of heat stroke risks.
Introduction
Annual average temperatures in Japan and the world have been increasing with various fluctuations. The global annual average temperature has increased by 0.76 °C per century1, whereas the annual average temperature in Japan has increased by 1.35 °C per century2, approximately twice as much as in the past 100 years. In addition, temperatures in Japan’s large cities have been increasing over a long period, especially daily minimum temperatures. This is attributable to urbanization and long-term global warming3. In the future, heat stress due to global warming and rising temperatures is expected to increase the risk of heat stroke in Japan, especially among the elderly, who have a weaker sense of temperature3,4.
In heat stroke countermeasures by Japanese ministries and agencies, a surveillance system is used to compile data on the number of emergency medical evacuations due to heat stroke. However, such indicator-based surveillance makes rapid response difficult because of the time required to collect and analyze data as well as identify cases. To solve this problem, event-based surveillance, which enables the early detection of abnormal events that are potential public health risks and prompt public health response, has been recommended in Japan and abroad5.
Event-based surveillance is based on unsystematized description and reporting. Data can be obtained from various internet sources, including media reports, online discussion platforms, routine reporting systems, personal information, and rumors6. The role of social networking service (SNS) posts in event-based surveillance is becoming more promising. In particular, Twitter posts contain information that cannot be obtained from observational data, such as emotions, subconsciousness, time, and location of the posters, and are considered to have strengths in early detection of unexpected and abnormal events, thereby enabling early response6. The ability of event-based surveillance to rapidly and accurately detect abnormal events has made great progress with the application of morbidity-related tweets, machine learning (ML), and deep learning (DL).
Although ML/DL methods have been used to classify morbidity-related tweets in English and other foreign languages, few studies have been published on morbidity-related Japanese tweets, particularly for heat stroke. The complexity of the Japanese language, including its use of various characters (hiragana, katakana, and kanji), lack of spaces between words, and variety of phrases, makes the development and application of natural language processing (NLP) challenging compared with English and other languages. Furthermore, tweets are often subjective, lack clinical diagnosis, and may not accurately reflect actual morbidity. To overcome these challenges, this study applied ML/DL algorithms to achieve high accuracy in classifying heat stroke–related Japanese tweets.
The primary contributions of this study are as follows:
-
Assess the performance of one ML algorithm and three DL algorithms on transformer-based networks for classifying heat stroke–related Japanese tweets.
-
Investigate Twitter’s potential of using Japanese tweets and DL algorithms on transformer-based networks for event-based surveillance at high spatiotemporal (hour and point) levels to facilitate early detection of heat stroke risks.
Literature survey
Research on event-based surveillance using heat stroke–related tweets and ML/DL is inadequate. Statistical models have been used to investigate the relationship between heat-related web searches, social media messages, and heat-related health outcomes. The results showed that the number of heat-related illnesses and dehydration cases exhibited a significant positive relationship with web data. In particular, heat-related illness cases showed positive associations with web search messages7.
Several studies have been conducted on surveillance using non-heat-related morbidity-related tweets and ML. Four classification methods—decision tree (DT), naive Bayes (NB), support vector machine (SVM), and artificial neural network (ANN)—have been used to predict the risk of a daily number of asthma-related emergency department visits being high, medium, or low from asthma-related tweets. The results showed that NB and SVM did not produce good prediction results but DT and ANN had accuracies slightly greater than 60%8. Another study9 used SVM to classify whether tweets were said by a person with influenza (positive) or not (negative). The SVM model successfully filtered out negative influenza tweets posted by those who did not catch the influenza (F-measure = 0.76). Another study10 on classifying influenza-related posts from irrelevant tweets using ML models such as DT, NB, SVM, and random forest showed that NB and SVM had better classification results with an F1-score of 0.7710. Although previous studies using morbidity-related tweets and ML have suggested effectiveness, the evaluation metrics of ML models for classification problems have not yet achieved high accuracy.
Compared with ML algorithms, deep neural network (DNN) models are advantageous because DL has a wide range of applications11. Recent approaches for tweet text classification employ DNNs. A study12 used a corpus collected from Twitter to perform binary classification: health-related personal experience tweets or nonpersonal experience tweets. The results revealed that a long short-term memory model outperformed conventional ML-based classification methods, such as logistic regression, DT, k-nearest neighbors (KNN), and SVM, in the classification problem. Another study13 on measles outbreak-related tweet classification tasks demonstrated that convolutional neural network (CNN) models outperformed KNN, NB, SVM, and random forest. In particular, a CNN model with two embedding combinations showed excellent performance on discussion themes and emotions expressed, with an accuracy of microaveraging F1 scores of 0.7811 and 0.8592, respectively, whereas a CNN model with Stanford embedding was superior on attitude toward vaccination, with an accuracy of microaveraging F1 score of 0.8642.
Further, DL has been applied to NLP, and DL algorithms using transformer-based networks are continuously being developed for various NLP tasks. Bidirectional encoder representations from transformers (BERT), A Lite BERT (ALBERT), and robustly optimized BERT pretraining approach (RoBERTa) are a few examples of DL algorithms on transformer-based networks14. NLP transformers exhibit higher accuracy in every practice than ML and DL techniques. For example, a study15 used COVID-19 and influenza Twitter datasets to train and evaluate the classification performance of BERT and RoBERTa language representation models in the context of influenza and COVID-19 infection detection. According to the findings, the classification performance (as measured by mean recall, F1, and accuracy scores) for both the COVID-19 and influenza Twitter datasets was generally slightly greater than 90%. Another study16 applied multilabel classification techniques, such as BERT, transformer-based models for Arabic language understanding, and ML or DL models, to identify tweets from infected individuals with Arabic tweets related to COVID-19 and influenza. The results revealed that their proposed algorithm achieved F1 scores of up to 88% and 94% in the influenza and COVID-19 case studies, respectively. These studies suggest that the performance of classifying infectious disease-related tweets can be improved using transformer-based models.
Methods
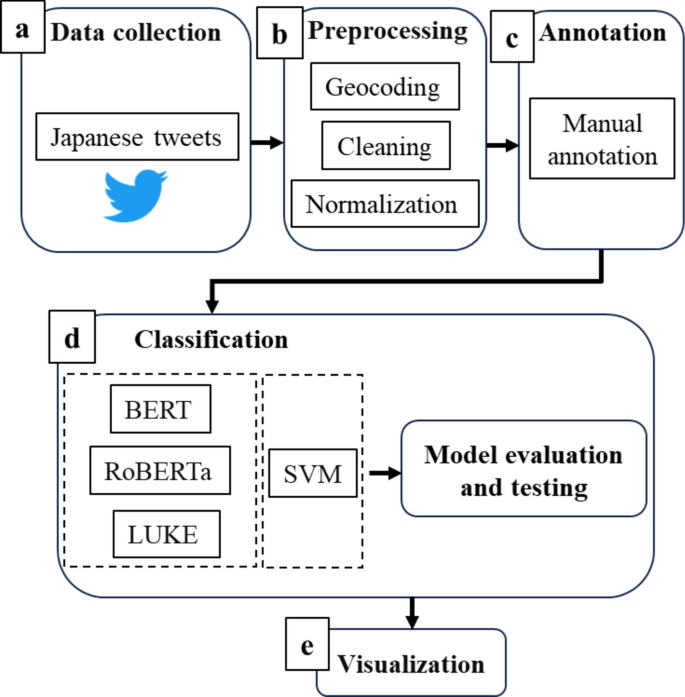
In this study, we address the above issues by evaluating the classification performance of transformer-based Japanese language models to detect abnormal events that could cause heat stroke. We also verified the possibility of an event-based surveillance system that can enable early detection and response to heat stroke health crises by visualizing in time–space and animated video, respectively. Figure 1 shows our research framework.
Study area
Nagoya City, Aichi Prefecture, which ranked fourth (according to the 2022 survey)17 after Tokyo, Saitama, and Osaka Prefectures in terms of the number of emergency medical evacuees due to heat stroke, was selected as the study area. The rate of temperature increase per 100 years in Nagoya is 2.9 °C, about twice the rate of increase at sites where urbanization has a relatively smaller impact. In addition, the rate of temperature increase is the third largest among large cities, after Tokyo and Fukuoka, resulting in a severe heat island phenomenon. Nagoya has a high urbanization rate of 89.3%, similar to Tokyo and Osaka. Because the rate of temperature increase is proportional to the urbanization rate, in the specific study area, which is the most urbanized area in Nagoya City, there are concerns about further impacts18.
Data collection
The data used in this study were collected as follows. We obtained data on heat stroke–related emergency medical evacuations at the block level from 4/22/2017 to 9/30/2022, provided by the Nagoya City Fire Department19. Using Twitter API v2 and BEARER_TOKEN, we collected tweets containing the keyword “hot” in Japanese that were posted during the same period and narrowed down the study area using a bounding box. The dataset comprised 27,040 tweets. A time-series correlation was observed between heat stroke data and tweets containing the keyword “hot” in Japanese (Supplementary Fig. S1). We determined that the Japanese word “hot” is the appropriate word to represent a heat stroke event. Therefore, we decided to use these tweets for our experiments.
Data preprocessing
Text preprocessing was performed on the collected tweet data. Cleaning methods were applied to remove noise in the tweets. Specifically, @(mentions), URLs, full-width space, new line, pictograph, retweets, only # of hashtags, punctuation, symbols, special characters, hyperlinks, and identifiers were removed. For normalization, we unified full-width, half-width, and hiragana notation, normalized alphanumeric characters to half-width and katakana characters to full-width, converted uppercase letters to lowercase letters, and converted all numeric values to 0 (Fig. 2). For instance, the uppercase part of “Natural” is converted to lowercase to become “natural.” This preprocessing step ensures that similar words are uniformly treated, regardless of character case. The substitution of numbers with zeros was performed because numerical expressions often hold limited relevance in NLP tasks despite their variety and frequency of occurrence. Herein, numbers were considered unnecessary for classifying heat stroke–related Japanese tweets. Therefore, we simplified the vocabulary by replacing all numbers with 0. In addition, the date and time were converted to Japan Standard Time. Further, geocoding was performed on two datasets, converting from addresses to longitude and latitude. Preprocessed text data and longitude and latitude data were added to the collected tweet data, and the text data before preprocessing were retained for annotation.
Example of preprocessing performed on Japanese tweets. We preprocessed the collected tweets with the following steps: cleaning and normalization. Cleaning methods were applied to remove noise in the tweets, such as @(mentions), punctuation, special characters, etc. Normalization was performed by converting all numeric values to 0.
Annotation
Accurate and consistent data annotation is essential for high-accuracy text classification. Each heat stroke–related Japanese tweet was annotated by the corresponding author, a native Japanese speaker and public health specialist. The preprocessed dataset was manually annotated according to the following criteria: tweets were labeled as true if they were confirmed to be related to heat stroke, or as false if they were not associated with heat stroke, nonfactual, such as denials, doubts, or “maybes.” The corresponding author conducted a second review of the annotations, and the co-author verified the annotations.
Dataset
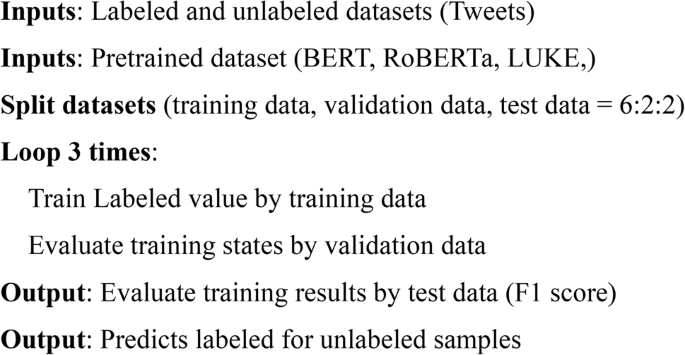
The labeled dataset for the experiment was structured data in CSV format, comprising 8 features (columns) and 27,040 rows: 1. hour, 2. day, 3. address, 4. longitude, 5. latitude, 6. text, 7. text after preprocessing, and 8. label (Supplementary Fig. S2). The dataset was divided into training, validation, and test data in the ratio of 6:2:2 for the experimental setup. The training data were used to fine-tune transformer-based pretrained language models. Next, the validation data were used to evaluate model performance while tuning the hyperparameters. Further, the test data were used to evaluate the final model performance. Meanwhile, for the baseline model, the training data were used to train the model and the test data were used to evaluate the trained model’s performance.
Types of classification algorithm
We used transformer-based pretrained Japanese language models and an ML model.
BERT
A transformer is a DL architecture based on the multihead attention mechanism20 used for NLP tasks. BERT is a DL model for NLP that comprises two steps: (i) pretraining and (ii) fine-tuning. Pretraining involves unsupervised learning of two types—masked language modeling and next-sentence prediction—using a large amount of unlabeled data. Pretraining comprises two tasks. The first task employs masked language modeling, which randomly masks some tokens from the input and predicts the masked tokens. The second task uses next-sentence prediction that jointly pretrains text-pair representations. During the pretraining process, a model is created to capture the ability to fill in words and judge the relationship between two sentences. When performing a specific task using BERT, a task-specific model is created based on this pretrained model by performing fine-tuning (retraining and adjusting the pretrained model) on the dataset for task21.
BERT-base
BERT has several variants with different model sizes. We used a BERT-base Japanese language model. The model architecture is the same as that of the original BERT. The model comprises 12 layers, 768 dimensions of hidden states, and 12 attention heads22. It is trained on the Japanese version of Wikipedia23.
RoBERTa-base
RoBERTa is an extension of BERT24. It is a 12-layer, 768-hidden-size transformer-based masked language model25. RoBERTa was trained using more data and larger batch sizes, removing the next-sentence prediction objective, having larger sequences, and using a dynamic masking technique24. A Japanese RoBERTa-base model pretrained on Japanese CC-100 and Japanese Wikipedia was used in this study25.
LUKE Japanese base lite
Language understanding with knowledge-based embeddings (LUKE) is a new pretrained contextualized representation of words and entities based on a bidirectional transformer trained using a large amount of entity-annotated corpus obtained from Wikipedia. The architecture of LUKE is shown in Fig. 3. LUKE treats words and entities in a document as input tokens and computes a representation for each token26. It achieves impressive empirical performance on important NLP benchmark tasks, such as entity typing, relation classification, named entity recognition, cloze-style question answering, and extractive question answering26,27, and outperforms other base-sized models27. The Japanese version of LUKE called LUKE Japanese base lite was used in this study28.
SVM
SVM is a well-known ML algorithm for text classification29. SVM was used as the baseline model in this study. The traditional ML model required further preprocessing in addition to the previously described data preprocessing. We performed the following preprocessing on the dataset: separating Japanese words with spaces, part-of-speech (verbs, adjectives, nouns, and adverbs) extraction, and converting text to nodes. The model was compared with the transformer-based models.
Experiments
Experiments were performed using BERT-base, RoBERTa-base, and LUKE Japanese base lite on the labeled dataset. As described in the dataset section, the data were divided into training, validation, and test sets in a 6:2:2 ratio for the experimental setup. We used Google Colaboratory Pro with T4 GPU to fine-tune, assess, and compare the text classification performance of the models using the same hyperparameter values as in their respective base versions. Table 1 lists the hyperparameters used in this study. For the baseline model, we applied SVM with stochastic gradient descent training by tuning alpha of 1e−3, and random state of 42, with the other parameters set to default. The results of various transformer-based language models and the baseline model were compared. The algorithm used to solve our task is described as follows.
Algorithm


Metrics for evaluating model performance
Model performance was evaluated using accuracy, precision, recall, and F1-score. Accuracy measures the proportion of correct predictions made by a model across an entire dataset. Precision is the ratio of true positives to the sum of true positives and false positives. It measures how many of the positive predictions made were actually correct. Recall is the ratio of true positives to the sum of true positives and false negatives. It measures how many of the actual positive instances were correctly identified. F1-score is a weighted harmonic mean of precision and recall. It ranges from 0 to 1, with 1 being the best possible score30. Four evaluation measures are given in Eqs. 1, 2, 3, and 4. Heatmaps of the normalized confusion matrices for the models are also generated for evaluation. Further, we examined the potential of an event-based surveillance system to detect and respond to heat stroke in its early stages by visualizing the correctly classified tweets (i.e., tweets predicted as true by the most accurate model and test data and still match the correct label), and the data on the heat stroke emergency medical evacuees in time–space and animated video, respectively.
where TP, TN, FP, and FN denote the number of True Positive, True Negative, False Positive, and False Negative, respectively.
Results
Table 2 shows the performance results of the four models—BERT-base, RoBERTa-base, LUKE Japanese base lite, and SVM models—on the dataset. Overall, the transformer-based models performed well and achieved good accuracy. Among all considered models, LUKE Japanese base lite achieved the highest mean scores in accuracy (85.52%), precision (87.90%), recall (82.72%), and F1-score (85.23%). BERT-base achieved the second position with an accuracy of 84.04%, precision of 85.92%, recall of 81.80%, and F1-score of 83.81%. RoBERTa-base gained the third position with an accuracy of 83.88%, precision of 87.37%, recall of 79.57%, and F1-score of 83.29%. SVM, as the baseline model, had the lowest mean scores in accuracy (72.73%), precision (78.47%), recall (63.38%), and F1-score (70.12%). The transformer-based models outperform SVM.
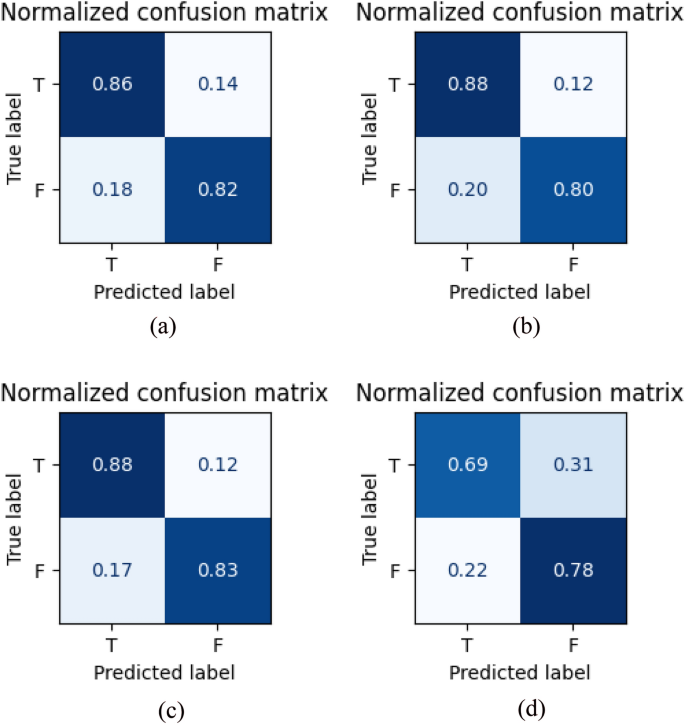
Figure 4a–d present the heatmaps of the normalized confusion matrices showing the binary classification results for BERT-base, RoBERTa-base, LUKE Japanese base lite, and SVM models, respectively. Rows represent instances in the actual class (true label), whereas columns represent instances in the predicted class (predicted label). Numbers represent the degree of correctly predicted classes. The closer the diagonal value is to 1, the better the classification performance (i.e., 100% correctly classified.). The values in the plot are rounded to two decimal places. For LUKE Japanese base lite, 88% were correctly classified as true and 12% were misclassified as false. Similarly, BERT-base, RoBERTa-base, and SVM show that the probability of correctly classifying true cases was 86%, 88%, and 69%, respectively.
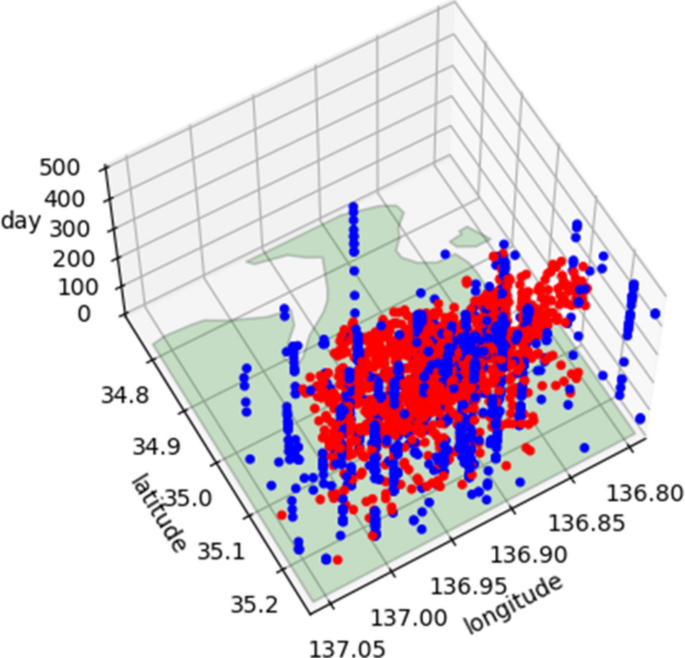
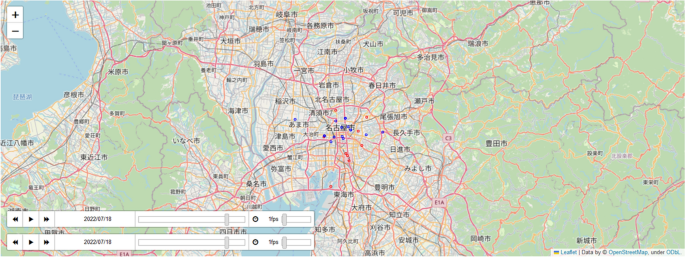
Figures 5 and 6 show the visualizations of two datasets in time–space and animated video, respectively. The two datasets were rounded daily. Red points present the location and date of ambulance dispatch due to heat stroke. Blue points present the location and date of tweets correctly classified as true and still matching the correct label. Although the points of the two datasets did not overlap each other much, they seemed to be located close to each other.
Animated video visualization. Red points: emergency transport owing to heat stroke; blue points: correctly classified tweets. Visualized the points on OpenStreetMap using Google Colaboratory Pro. Sources: OpenStreetMap (https://www.openstreetmap.org/).
Discussion
Transformer-based pretrained language models outperform other ML/DL models in previous studies. This study revealed that the LUKE Japanese model outperforms existing language models, including BERT, RoBERTa, and SVM. Nevertheless, there seems to be a difference in accuracy depending on the content of the corpus or dataset used. Previous studies have shown that in the classification results using transformer-based pretrained language models and text or tweets, the evaluation metrics tend to be lower for tweets than for text data, such as news data30,31. A similar pattern has been observed in studies of Japanese text classification. Although the accuracy of the classification results for Japanese language news articles such as the livedoor news corpus31,32 is high, the classification results for Japanese language tweets tend to be lower32,33. It could be considered that Japanese tweets contained a mixture of words and sentences that were ambiguous or unrelated to each other in terms of authenticity, attributable to lower accuracy.
This study demonstrates the potential of combining Japanese tweets and transformer-based pretrained language models for the early detection of heat stroke risks as an event-based public health surveillance. Owing to selection bias, collecting and analyzing tweets containing keywords other than “hot” would have been preferable. Although we initially planned to collect tweets containing other keywords, we could not proceed with the collection as charges were applied immediately afterward. Fortunately, we identified a time-series correlation between heat stroke data and tweets containing the Japanese keyword “hot” (Supplementary Fig. S1). We determined that the Japanese word “hot” was the most suitable word to represent a heat stroke event and decided to use tweets containing this keyword in our experiments. Similarly, collecting tweets within bounding boxes introduces bias because it only captures geo-tagged data. This is because geo-tagged users do not accurately represent the broad Twitter population. To mitigate this bias, including all prefectures in Japan rather than limiting the dataset to Aichi Prefecture would have been highly effective. However, few prefectures provided the heat stroke data required for validation. In the future, emphasizing the importance of event-based surveillance to prefectures, request their cooperation in providing heat stroke data, and conduct experiments covering all prefectures in Japan will be essential. A key future task will involve conducting quantitative analyses, such as spatiotemporal cross-correlation after collecting and analyzing data from all prefectures in Japan. Our methodology can be extended to respond to emerging and reemerging infectious diseases of pandemic potential. Future efforts will focus on establishing a heat stroke early warning system for Aichi Prefecture and expanding it to a nationwide alert system for all of Japan.
Data availability
The data used in this study were obtained from publicly available social media platform, Twitter. The datasets used during the current study are available from the corresponding author upon reasonable request.
References
-
Japan Meteorological Agency. Secular changes in global annual mean temperature anomalies (1891–2023). https://www.data.jma.go.jp/cpdinfo/temp/an_wld.html (2024).
-
Japan Meteorological Agency. Secular changes in annual average temperature anomalies in Japan (1898–2023). https://www.data.jma.go.jp/cpdinfo/temp/an_jpn.html (2024).
-
Toosty, N. T., Hagishima, A. & Tanaka, K. I. Heat health risk assessment analysing heatstroke patients in Fukuoka City, Japan. PLoS ONE 16, e0253011 (2021).
-
Nakamura, S. & Aruga, T. Epidemiology of heat illness. Jpn Med. Assoc. J. 56, 162–166 (2013).
-
WHO. A guide to establishing event-based surveillance. ISBN 978 92 9061 321 3 (2008).
-
Gupta, A. & Katarya, R. Social media based surveillance systems for healthcare using machine learning: A systematic review. J. Biomed. Inform. 108, 103500 (2020).
-
Jung, J., Uejio, C. K., Duclos, C. & Jordan, M. Using web data to improve surveillance for heat sensitive health outcomes. Environ. Health 18, 59 (2019).
-
Ram, S., Zhang, W., Williams, M. & Pengetnze, Y. Predicting asthma-related emergency department visits using big data. IEEE J. Biomed. Health Inform. 19, 1216–1223 (2015).
-
Aramaki, E., Maskawa, S. & Morita, M. Twitter catches the flu: detecting influenza epidemics using Twitter in Proceedings of the 2011 conference on empirical methods in natural language processing 1568–1576. (2011).
-
Jain, V. K. & Kumar, S. An effective approach to track levels of influenza-A (H1N1) pandemic in India using Twitter. Procedia Comput. Sci. 70, 801–807 (2015).
-
Alzubaidi, L. et al. Review of deep learning: Concepts, CNN architectures, challenges, applications, future directions. J. Big Data 8, 53 (2021).
-
Jiang, K. et al. Identifying tweets of personal health experience through word embedding and LSTM neural network. BMC Bioinform. 19(suppl. 8), 210 (2018).
-
Du, J. et al. Public perception analysis of tweets during the 2015 measles outbreak: comparative study using convolutional neural network models. J. Med. Internet Res. 20, e236 (2018).
-
Azizah, S. F. N., Cahyono, H. D., Sihwi, S. W. & Widiarto, W. Performance analysis of transformer based models (BERT, ALBERT, and RoBERTa) in fake news detection. arXiv:2308.04950 (2023).
-
Tian, Y., Zhang, W., Duan, L., McDonald, W. & Osgood, N. Comparison of pretrained transformer-based models for influenza and COVID-19 detection using social media text data in Saskatchewan, Canada. Front. Digit. Health 5, 1203874 (2023).
-
Alsudias, L. & Rayson, P. Social media monitoring of the COVID-19 pandemic and influenza epidemic with adaptation for informal language in Arabic Twitter data: qualitative study. JMIR Med. Inform. 9, e27670 (2021).
-
Fire & Disaster Management Agency (FDMA). Ministry of Internal Affairs and Communications, Emergency medical evacuations due to heat stroke. Emergency Medical Evacuees by Prefecture (Compared to the Previous Year) (Graph). https://www.fdma.go.jp/disaster/heatstroke/post3.html (2022)
-
Nagoya City. Guidelines for environmental considerations in Urban Centers. Four issues. In. https://www.city.nagoya.jp/kankyo/page/0000116688.html (2019).
-
Nagoya City Fire Department. https://www.city.nagoya.jp/shobo/page/0000101121.html
-
Vaswani, A. et al. Attention is all you need in Proceedings of the 31st international conference on neural information processing systems NIPS’17 6000–6010. https://doi.org/10.5555/3295222.3295349 (Curran Associates Inc, 2017).
-
Devlin, J., Chang, M. W., Lee, K. & Toutanova, K. BERT: pretraining of deep bidirectional transformers for language understanding. arXiv:1810.04805. (2018).
-
BERT Base Japanese. https://huggingface.co/tohoku-nlp/bert-base-japanese
-
Pretrained Japanese BERT Models. https://github.com/cl-tohoku/bert-japanese/
-
Liu, Y. et al. RoBERTa: A robustly optimized BERT pretraining approach. arXiv:1907.11692. (2019).
-
Japanese Roberta Base. https://huggingface.co/rinna/japanese-roberta-base
-
Yamada, I., Asai, A., Shindo, H., Takeda, H. & Matsumoto, Y. LUKE: deep contextualized entity representations with entity-aware self-attention in Proceedings of the 2020 conference on empirical methods in natural language processing (EMNLP), 6442–6454. arXiv:2010.01057. (2020).
-
LUKE Japanese Base Lite. https://huggingface.co/studio-ousia/luke-japanese-base-lite
-
Ramesh, B. & Sathiaseelan, J. G. R. An advanced multi class instance selection based support vector machine for text classification. Procedia Comput. Sci. 57, 1124–1130 (2015).
-
Maham, S. et al. ANN: Adversarial news net for robust fake news classification. Sci. Rep. 14, 7897 (2024).
-
Wagh, V., Khandve, S., Joshi, I., Wani, A., Kale, G. & Joshi, R. Comparative study of long document classification. arXiv:2111.00702. (2021).
-
Itoh, Y., Shinnou, H. & Japanese, D. S. ELECTRA model using a small corpus in Proceedings of the 27th annual conference of the association for natural language processing (RANLP-2021). (2021).
-
Matsumoto, N., Ueno, F. & Ohta, M. A method of incendiary tweet detection using BERT in Proceedings of the 13th forum on data engineering and information management (DEIM2021). (2021).
Acknowledgements
This work is supported by the Collaboration Research Program of IDEAS, Chubu University IDEAS202309.
Author information
Authors and Affiliations
Contributions
This work was carried out in collaboration among all authors. Conceptualization: S.A., methodology: S.A., Y.K., S.S., visualization: S.A., Y.K., writing–original draft preparation: S.A., writing–review and editing: S.A., Y.K., S.S. All authors reviewed, discussed, and approved the final manuscript for submission.
Corresponding author
Ethics declarations
Competing interests
The authors declare no competing interests.
Additional information
Publisher’s note
Springer Nature remains neutral with regard to jurisdictional claims in published maps and institutional affiliations.
Supplementary Information
Supplementary Video 1.
Rights and permissions
Open Access This article is licensed under a Creative Commons Attribution-NonCommercial-NoDerivatives 4.0 International License, which permits any non-commercial use, sharing, distribution and reproduction in any medium or format, as long as you give appropriate credit to the original author(s) and the source, provide a link to the Creative Commons licence, and indicate if you modified the licensed material. You do not have permission under this licence to share adapted material derived from this article or parts of it. The images or other third party material in this article are included in the article’s Creative Commons licence, unless indicated otherwise in a credit line to the material. If material is not included in the article’s Creative Commons licence and your intended use is not permitted by statutory regulation or exceeds the permitted use, you will need to obtain permission directly from the copyright holder. To view a copy of this licence, visit http://creativecommons.org/licenses/by-nc-nd/4.0/.
About this article
Cite this article
Anno, S., Kimura, Y. & Sugita, S. Using transformer-based models and social media posts for heat stroke detection.
Sci Rep 15, 742 (2025). https://doi.org/10.1038/s41598-024-84992-y
-
Received:
-
Accepted:
-
Published:
-
DOI: https://doi.org/10.1038/s41598-024-84992-y
Keywords
This post was originally published on this site be sure to check out more of their content


